QUESTION IMAGE
Question
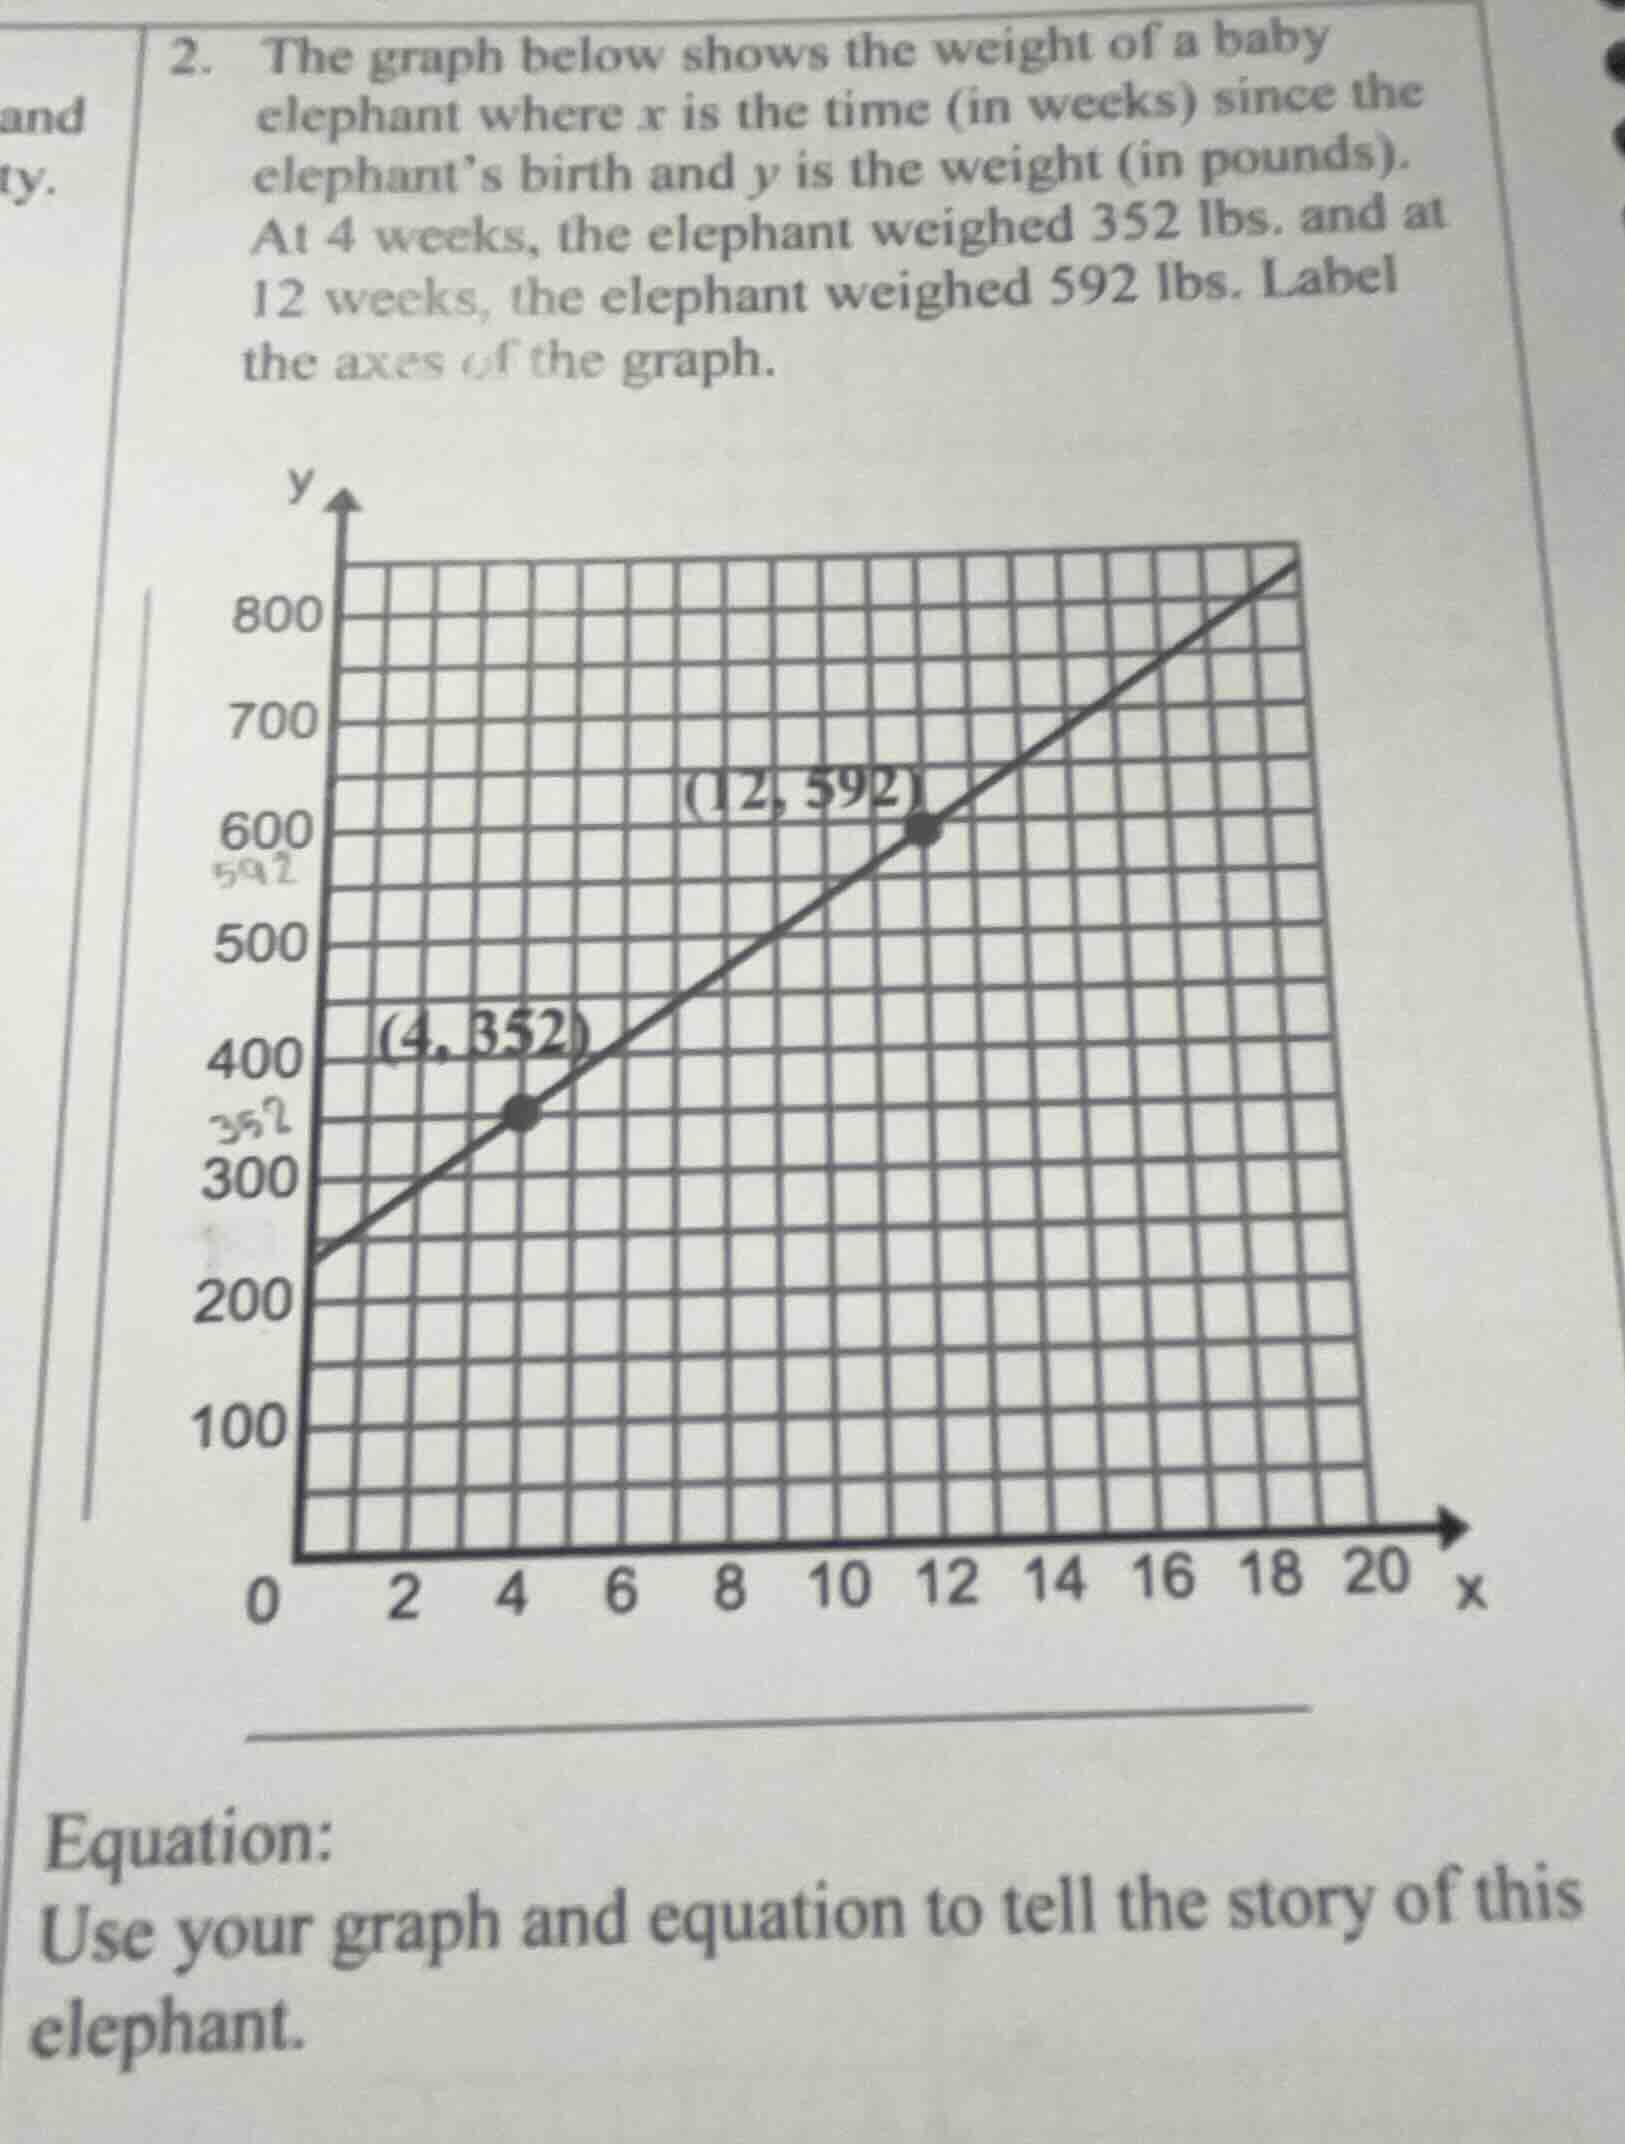
- the graph below shows the weight of a baby elephant where $x$ is the time (in weeks) since the elephants birth and $y$ is the weight (in pounds). at 4 weeks, the elephant weighed 352 lbs. and at 12 weeks, the elephant weighed 592 lbs. label the axes of the graph.
equation:
use your graph and equation to tell the story of this elephant.
Step1: Label the axes
- x-axis: Time (in weeks) since birth
- y-axis: Weight (in pounds) of the baby elephant
Step2: Calculate slope (rate of growth)
Slope formula: $m=\frac{y_2-y_1}{x_2-x_1}$
$m=\frac{592-352}{12-4}=\frac{240}{8}=30$
Step3: Find y-intercept (birth weight)
Use point-slope form $y-y_1=m(x-x_1)$ with $(4,352)$:
$y-352=30(x-4)$
$y-352=30x-120$
$y=30x+232$
The y-intercept $(0,232)$ is birth weight.
Step4: Interpret the equation and graph
The linear equation shows steady weekly weight gain.

Snap & solve any problem in the app
Get step-by-step solutions on Sovi AI
Photo-based solutions with guided steps
Explore more problems and detailed explanations
Axis Labels:
- x-axis: Time (in weeks) since the elephant's birth
- y-axis: Weight (in pounds) of the baby elephant
Equation:
$y=30x+232$
Story of the Elephant:
This baby elephant weighed 232 pounds at birth (when $x=0$). After that, it gained weight at a steady rate of 30 pounds per week. At 4 weeks old, it weighed 352 pounds, and by 12 weeks old, its weight had increased to 592 pounds. The straight line on the graph confirms this consistent, linear growth pattern over time.