QUESTION IMAGE
Question
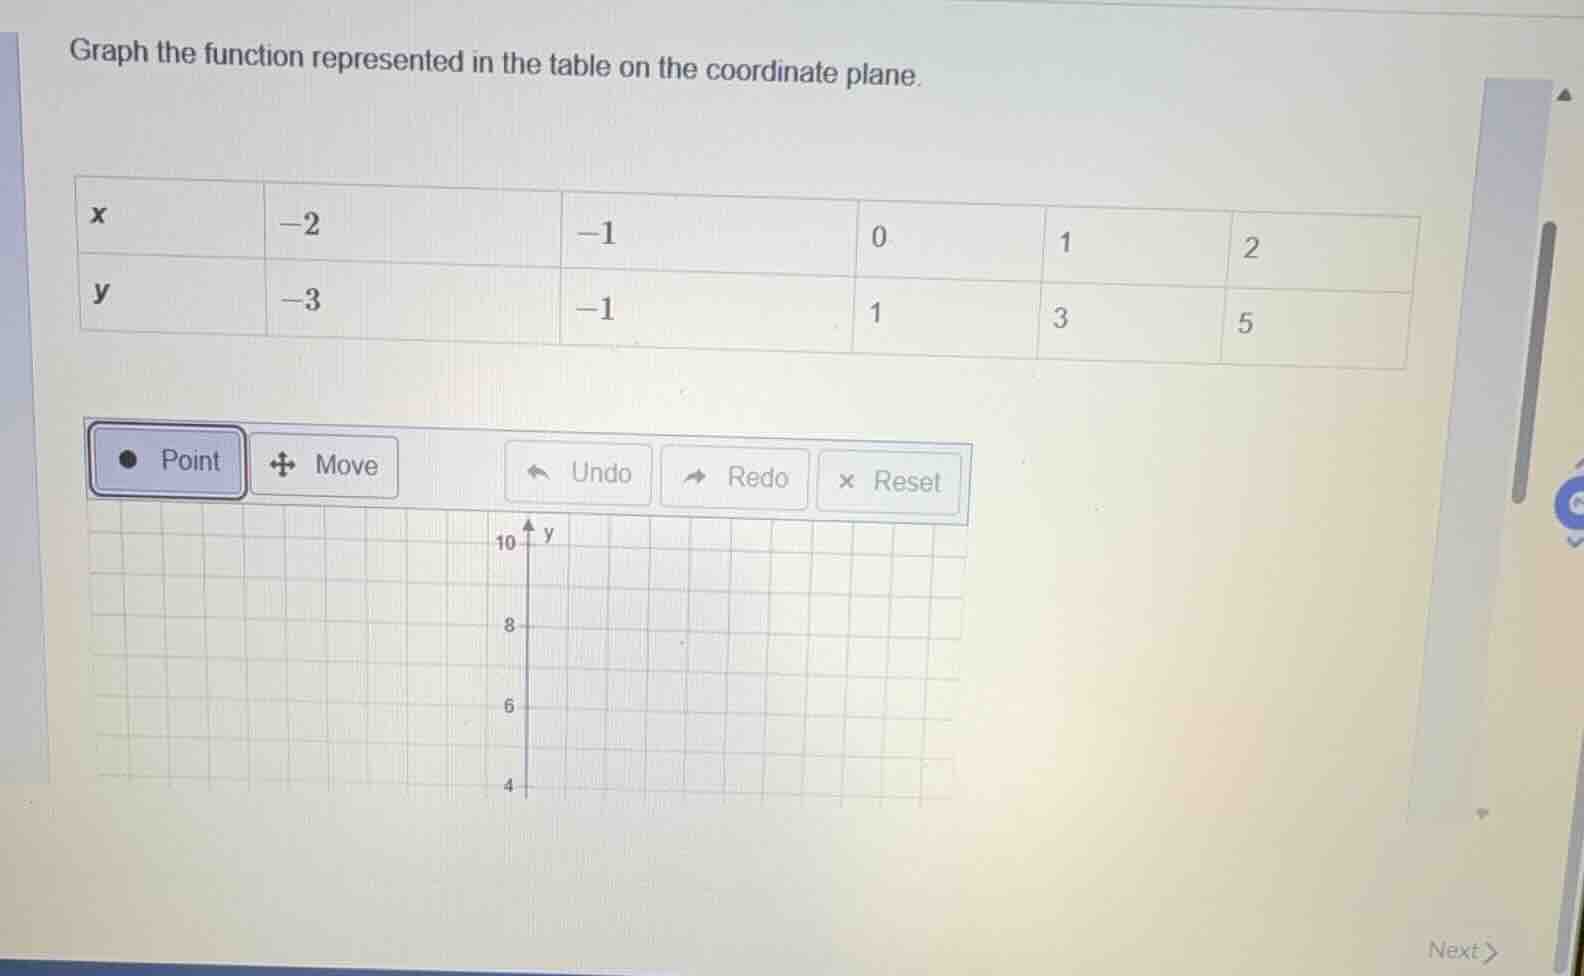
graph the function represented in the table on the coordinate plane.
| x | -2 | -1 | 0 | 1 | 2 |
| y | -3 | -1 | 1 | 3 | 5 |
(coordinate plane and graphing tools shown)
Step1: Identify coordinate pairs
Extract $(x,y)$ from the table: $(-2,-3), (-1,-1), (0,1), (1,3), (2,5)$
Step2: Plot each coordinate pair
Mark each point on the grid:
- For $(-2,-3)$: Move 2 left on x-axis, 3 down on y-axis, mark the point.
- For $(-1,-1)$: Move 1 left on x-axis, 1 down on y-axis, mark the point.
- For $(0,1)$: Stay at x=0, move 1 up on y-axis, mark the point.
- For $(1,3)$: Move 1 right on x-axis, 3 up on y-axis, mark the point.
- For $(2,5)$: Move 2 right on x-axis, 5 up on y-axis, mark the point.
Step3: Connect the plotted points
Draw a straight line through all 5 points (since this is a linear function).

Snap & solve any problem in the app
Get step-by-step solutions on Sovi AI
Photo-based solutions with guided steps
Explore more problems and detailed explanations
The function is graphed by plotting the points $(-2,-3)$, $(-1,-1)$, $(0,1)$, $(1,3)$, $(2,5)$ and connecting them with a straight line on the coordinate plane.