QUESTION IMAGE
Question
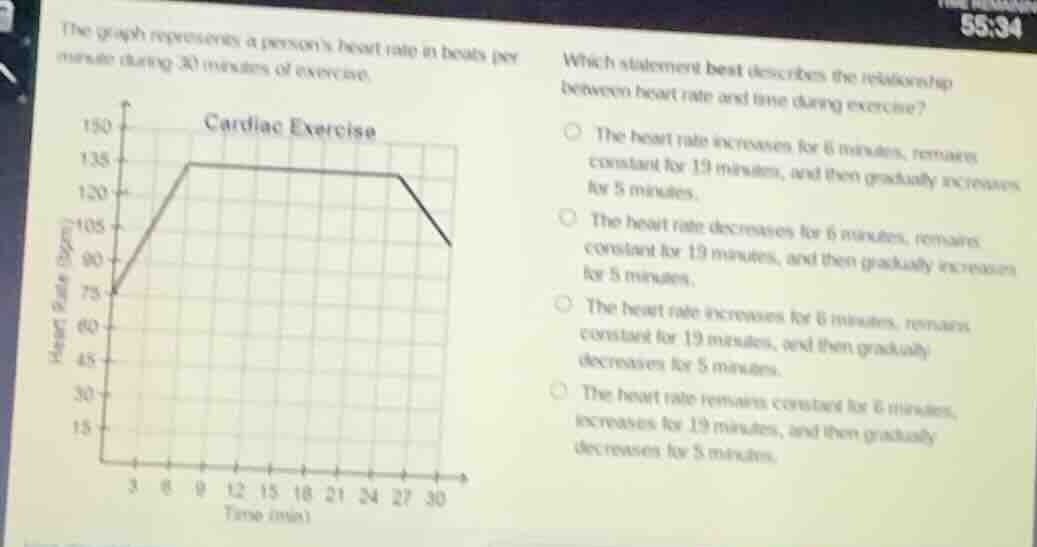
the graph represents a persons heart rate in beats per minute during 30 minutes of exercise.cardiac exercisewhich statement best describes the relationship between heart rate and time during exercise?○ the heart rate increases for 6 minutes, remains constant for 19 minutes, and then gradually increases for 5 minutes.○ the heart rate decreases for 6 minutes, remains constant for 19 minutes, and then gradually increases for 5 minutes.○ the heart rate increases for 6 minutes, remains constant for 19 minutes, and then gradually decreases for 5 minutes.○ the heart rate remains constant for 6 minutes, increases for 19 minutes, and then gradually decreases for 5 minutes.
- Increasing phase: The line rises from 0 to 6 minutes, starting at ~75 bpm to 135 bpm.
- Constant phase: The line stays flat from 6 to 25 minutes (25-6=19 minutes) at 135 bpm.
- Decreasing phase: The line falls from 25 to 30 minutes (30-25=5 minutes) from 135 bpm to ~90 bpm. This matches the third option.

Snap & solve any problem in the app
Get step-by-step solutions on Sovi AI
Photo-based solutions with guided steps
Explore more problems and detailed explanations
C. The heart rate increases for 6 minutes, remains constant for 19 minutes, and then gradually decreases for 5 minutes.