QUESTION IMAGE
Question
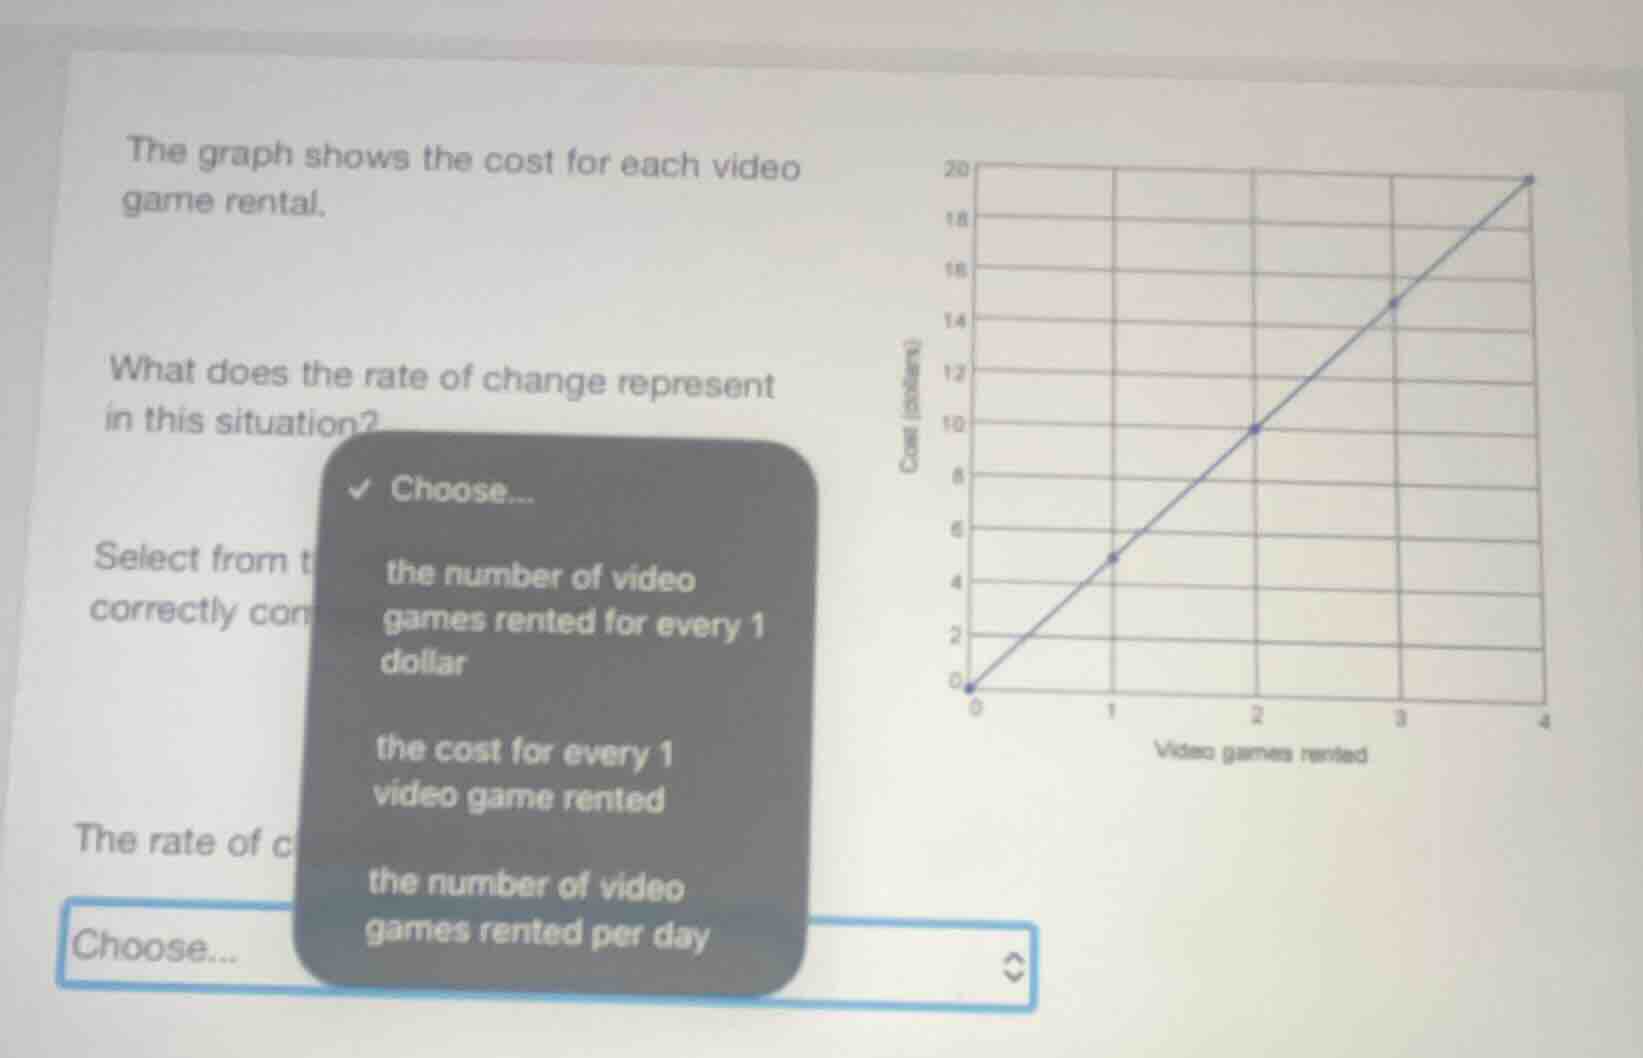
the graph shows the cost for each video game rental.
what does the rate of change represent in this situation?
select from the correctly con
the rate of c
choose...
choose... the number of video games rented for every 1 dollar
the cost for every 1 video game rented
the number of video games rented per day
The graph has "Video games rented" on the x - axis (independent variable) and "Cost (dollars)" on the y - axis (dependent variable). The rate of change of a linear graph (slope) is calculated as $\frac{\text{change in }y}{\text{change in }x}$. Here, the change in $y$ is the change in cost and the change in $x$ is the change in the number of video games rented. So the rate of change represents how much the cost changes for a unit change (1 unit) in the number of video games rented, which is the cost for every 1 video game rented. The first option is incorrect as it reverses the relationship (number of games per dollar instead of cost per game), and the third option is incorrect as the graph does not involve time (days) as a variable.

Snap & solve any problem in the app
Get step-by-step solutions on Sovi AI
Photo-based solutions with guided steps
Explore more problems and detailed explanations
the cost for every 1 video game rented