QUESTION IMAGE
Question
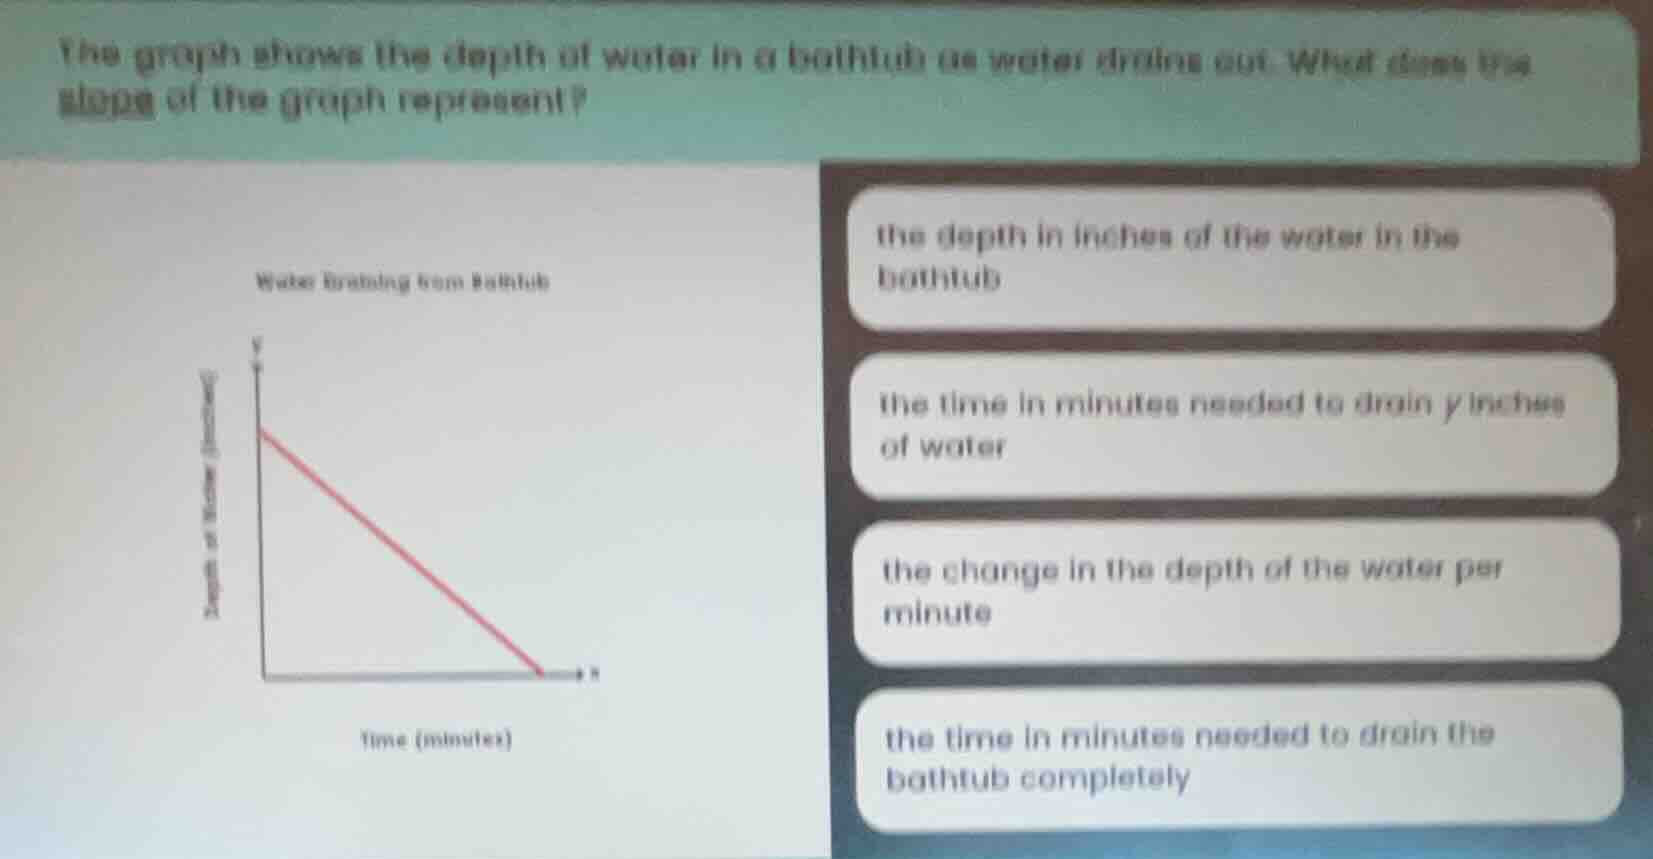
the graph shows the depth of water in a bathtub as water drains out. what does the slope of the graph represent?
water draining from bathtub
options:
- the depth in inches of the water in the bathtub
- the time in minutes needed to drain y inches of water
- the change in the depth of the water per minute
- the time in minutes needed to drain the bathtub completely
Brief Explanations
The slope of a graph represents the rate of change of the y-axis variable with respect to the x-axis variable. Here, the y-axis is water depth (inches) and the x-axis is time (minutes), so the slope is the change in depth per minute.

Snap & solve any problem in the app
Get step-by-step solutions on Sovi AI
Photo-based solutions with guided steps
Explore more problems and detailed explanations
the change in the depth of the water per minute