QUESTION IMAGE
Question
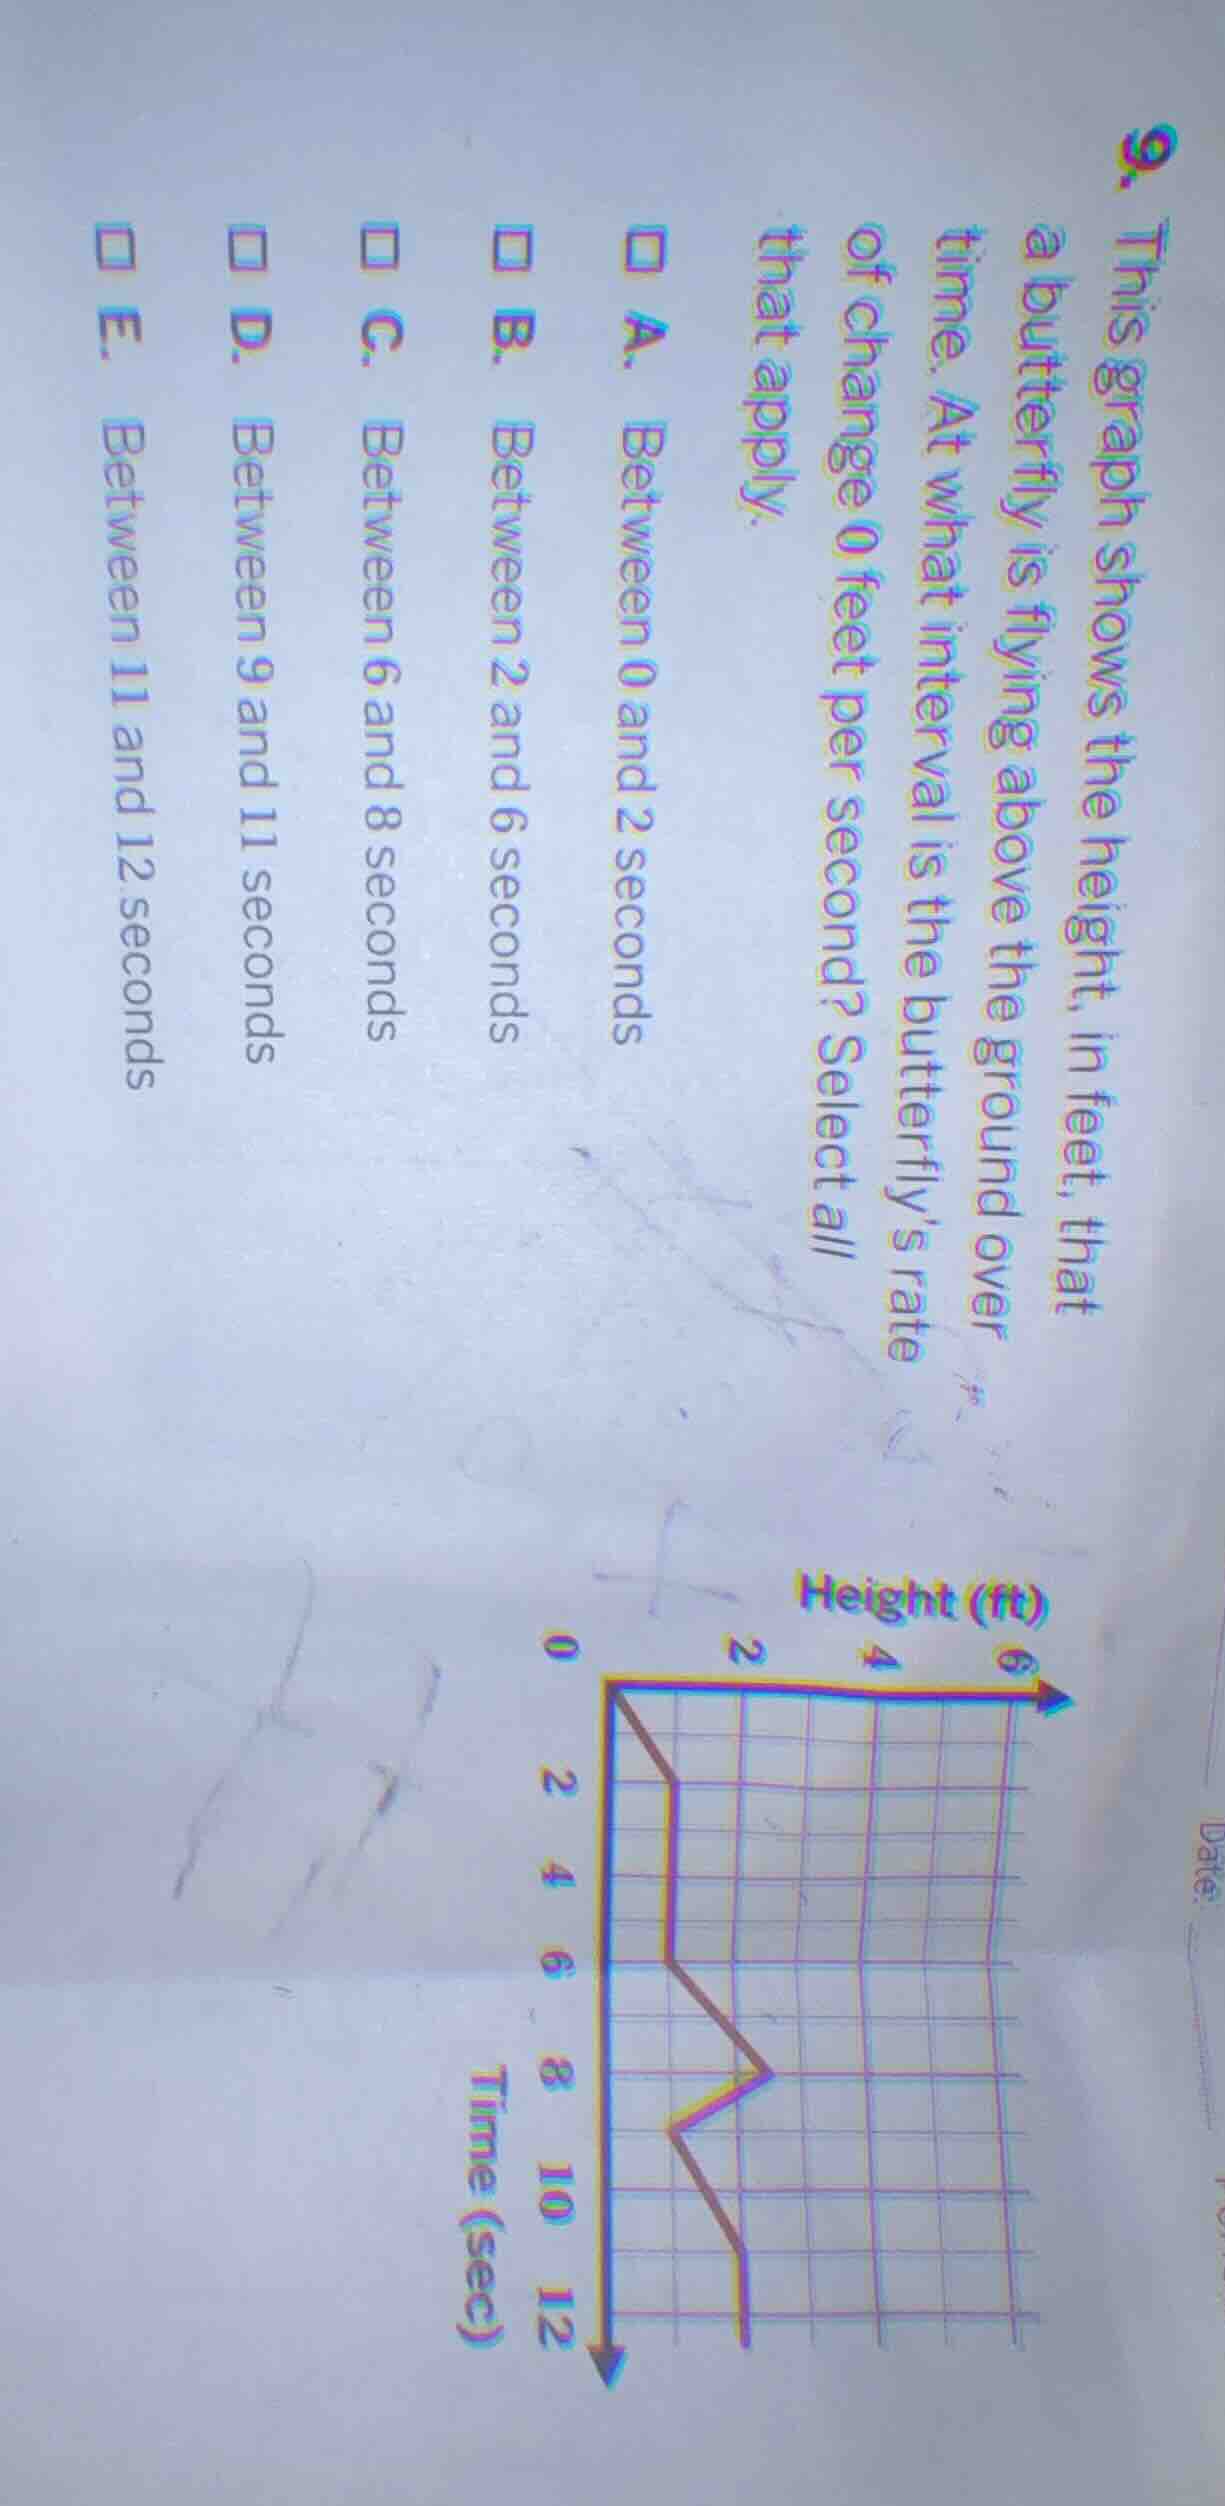
- this graph shows the height, in feet, that a butterfly is flying above the ground over time. at what interval is the butterfly’s rate of change 0 feet per second? select all that apply.
a. between 0 and 2 seconds
b. between 2 and 6 seconds
c. between 6 and 8 seconds
d. between 9 and 11 seconds
e. between 11 and 12 seconds
(graph: x - axis time (sec) from 0 to 12, y - axis height (ft) from 0 to 6, with a piece - wise linear graph)
Step1: Define rate of change
The rate of change of height over time is $\frac{\Delta \text{Height}}{\Delta \text{Time}}$. A rate of 0 means $\Delta \text{Height}=0$ (height stays constant).
Step2: Analyze interval 0-2 sec
Height increases from 0 to 1 ft. $\frac{1-0}{2-0}=0.5
eq 0$.
Step3: Analyze interval 2-6 sec
Height stays at 1 ft. $\frac{1-1}{6-2}=0$.
Step4: Analyze interval 6-8 sec
Height increases from 1 to 2 ft. $\frac{2-1}{8-6}=0.5
eq 0$.
Step5: Analyze interval 9-11 sec
Height decreases from 2 to 1 ft. $\frac{1-2}{11-9}=-0.5
eq 0$.
Step6: Analyze interval 11-12 sec
Height stays at 1 ft. $\frac{1-1}{12-11}=0$.

Snap & solve any problem in the app
Get step-by-step solutions on Sovi AI
Photo-based solutions with guided steps
Explore more problems and detailed explanations
B. Between 2 and 6 seconds
E. Between 11 and 12 seconds