QUESTION IMAGE
Question
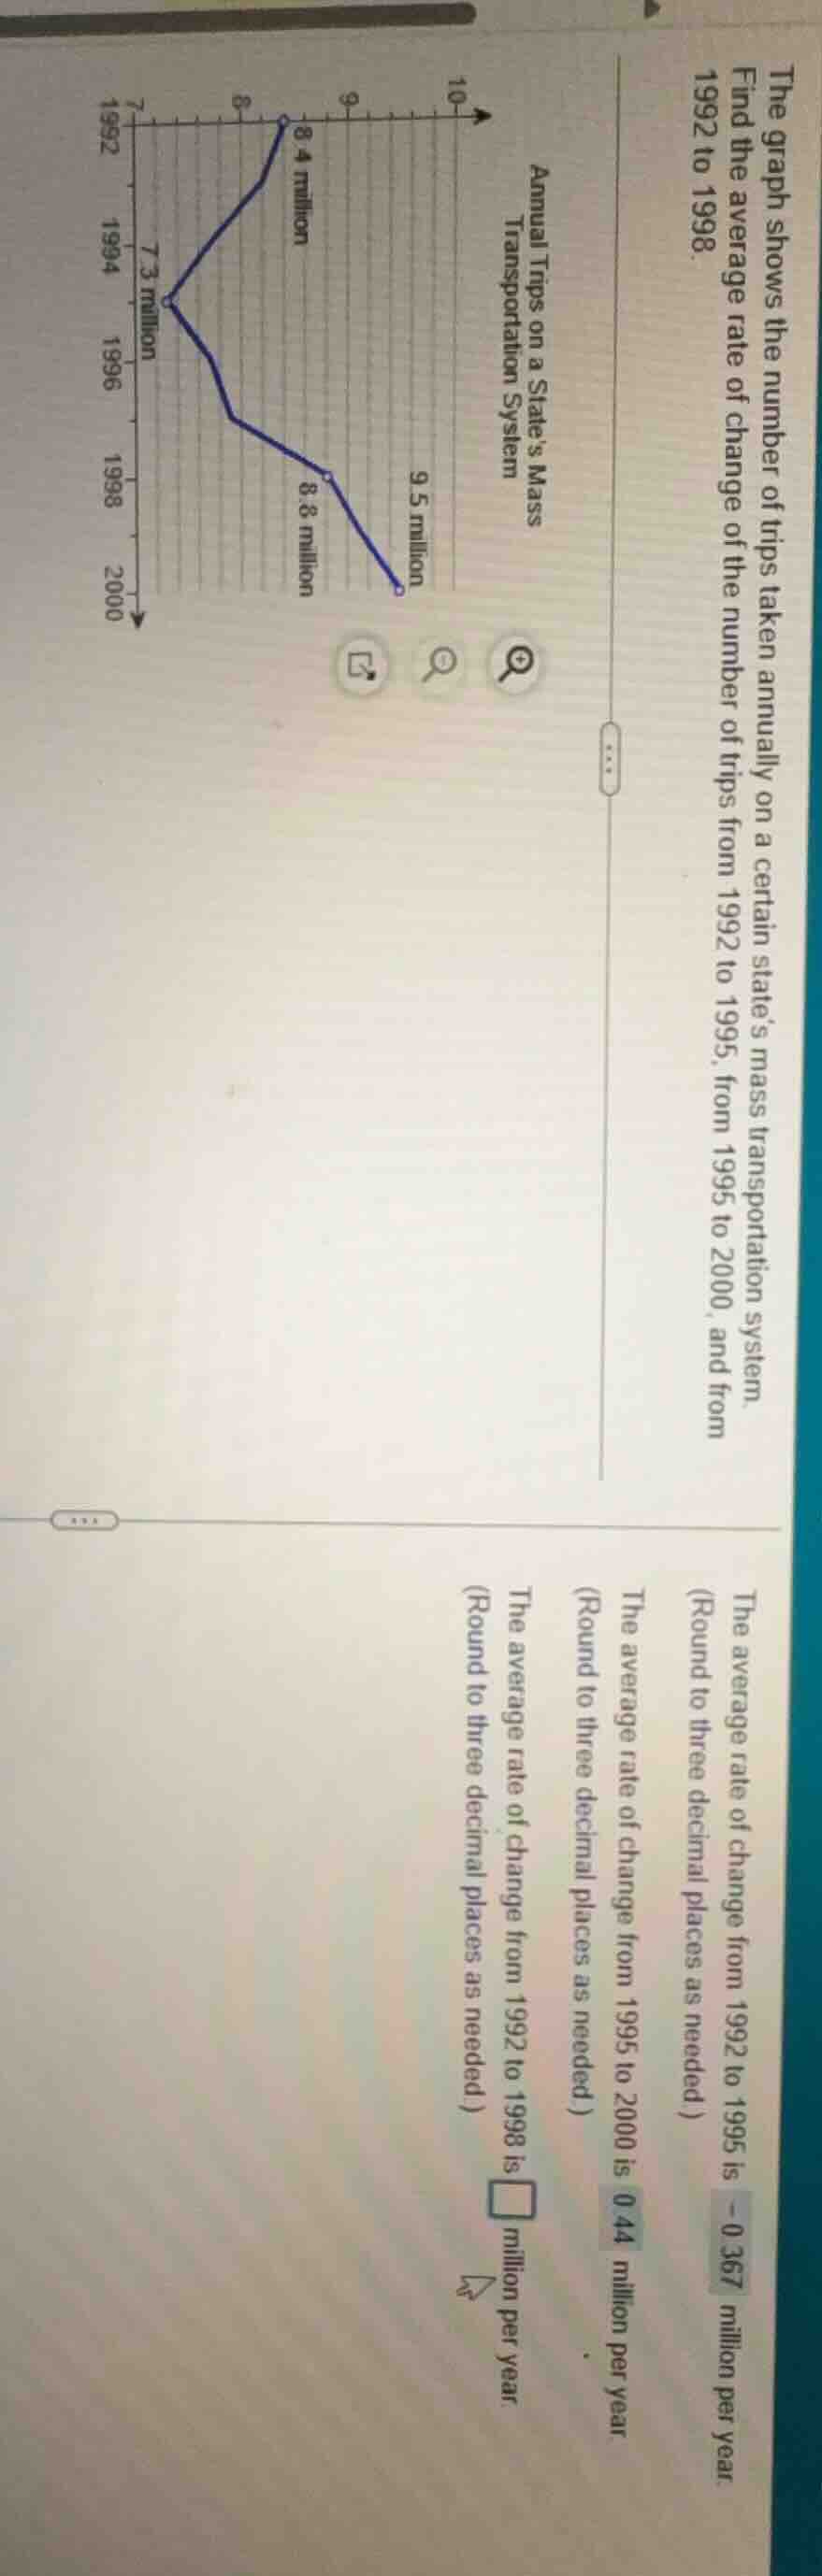
the graph shows the number of trips taken annually on a certain state’s mass transportation system. find the average rate of change of the number of trips from 1992 to 1995, from 1995 to 2000, and from 1992 to 1998. annual trips on a state’s mass transportation system the average rate of change from 1992 to 1995 is - 0.367 million per year. (round to three decimal places as needed.) the average rate of change from 1995 to 2000 is 0.44 million per year. (round to three decimal places as needed.) the average rate of change from 1992 to 1998 is \\(\square\\) million per year (round to three decimal places as needed.)
Step1: Identify values and time period
In 1992, the number of trips is 8.4 million. In 1998, the number of trips is 8.3 million. The time period from 1992 to 1998 is \(1998 - 1992 = 6\) years.
Step2: Apply average rate of change formula
The formula for average rate of change is \(\frac{\text{Final Value}-\text{Initial Value}}{\text{Final Year}-\text{Initial Year}}\). Substituting the values: \(\frac{8.3 - 8.4}{1998 - 1992}=\frac{- 0.1}{6}\approx - 0.017\) (rounded to three decimal places).

Snap & solve any problem in the app
Get step-by-step solutions on Sovi AI
Photo-based solutions with guided steps
Explore more problems and detailed explanations
\(-0.017\)