QUESTION IMAGE
Question
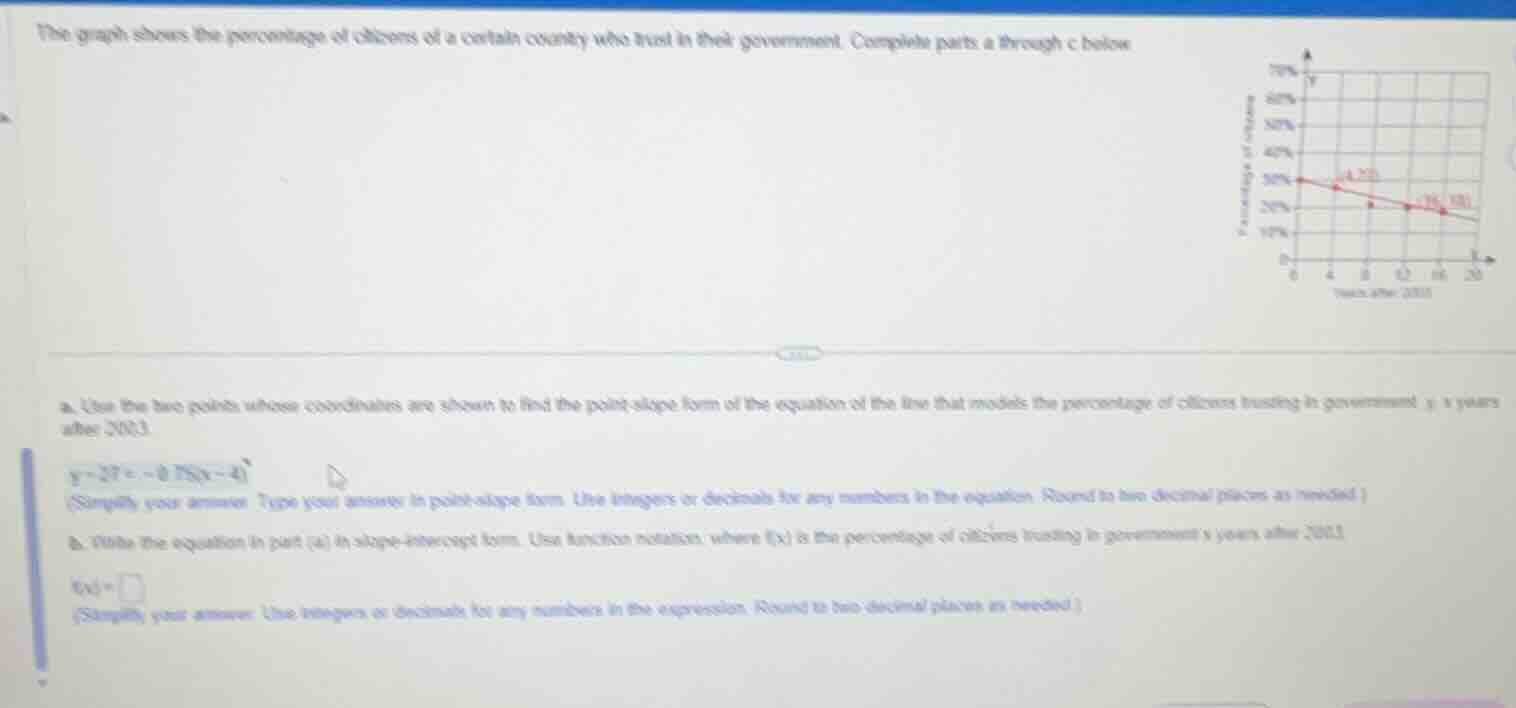
the graph shows the percentage of citizens of a certain country who trust in their government. complete parts a through c below
a. use the two points whose coordinates are shown to find the point - slope form of the equation of the line that models the percentage of citizens trusting in government ( y ) ( x ) years after 2003.
( y - 27=-0.75(x - 4) )
(simplify your answer. type your answer in point - slope form. use integers or decimals for any numbers in the equation. round to two decimal places as needed.)
b. write the equation in part (a) in slope - intercept form. use function notation, where ( f(x) ) is the percentage of citizens trusting in government ( x ) years after 2003.
( f(x)=square )
(simplify your answer. use integers or decimals for any numbers in the expression. round to two decimal places as needed.)
Step1: Calculate the slope
The two points are $(4, 27)$ and $(16, 18)$. Slope formula: $m=\frac{y_2-y_1}{x_2-x_1}$
$m=\frac{18-27}{16-4}=\frac{-9}{12}=-0.75$
Step2: Rewrite point-slope form (verify)
Using point $(4,27)$: $y-27=-0.75(x-4)$
Step3: Convert to slope-intercept form
Expand and solve for $y$:
$y-27=-0.75x + 3$
$y=-0.75x + 3 + 27$
$y=-0.75x + 30$
Rewrite in function notation: $f(x)=-0.75x+30$

Snap & solve any problem in the app
Get step-by-step solutions on Sovi AI
Photo-based solutions with guided steps
Explore more problems and detailed explanations
a. $y-27=-0.75(x-4)$
b. $f(x)=-0.75x+30$