QUESTION IMAGE
Question
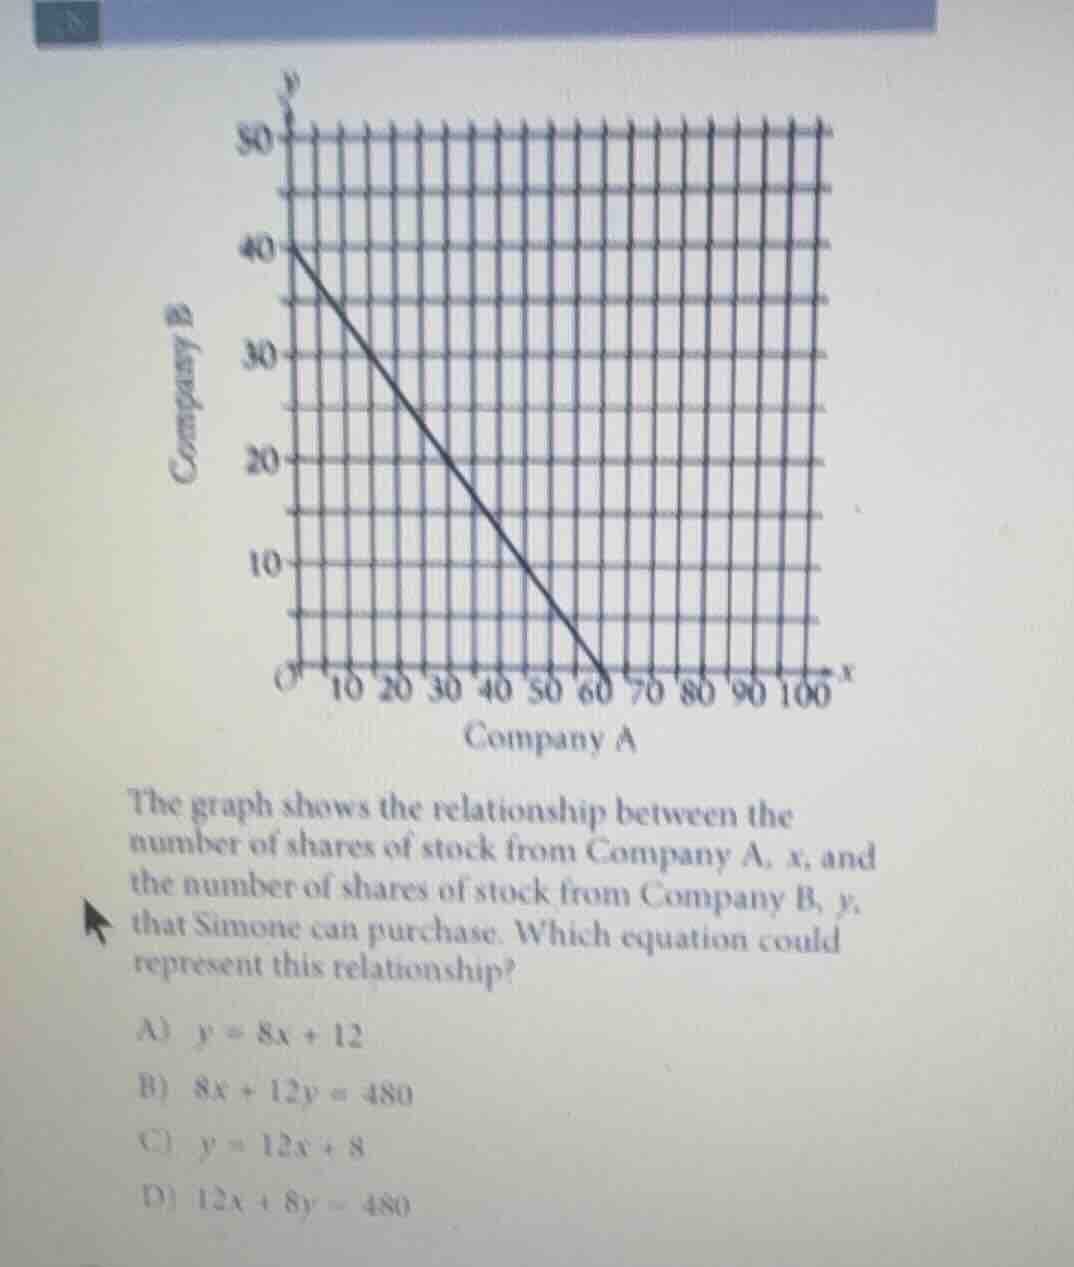
the graph shows the relationship between the number of shares of stock from company a, x, and the number of shares of stock from company b, y, that simone can purchase. which equation could represent this relationship? a) $y = 8x + 12$ b) $8x + 12y = 480$ c) $y = 12x + 8$ d) $12x + 8y = 480$
Step1: Identify intercept points
The line crosses the x-axis at $(60, 0)$ and y-axis at $(0, 40)$.
Step2: Calculate slope
Slope $m = \frac{y_2 - y_1}{x_2 - x_1} = \frac{40 - 0}{0 - 60} = -\frac{2}{3}$
Step3: Write slope-intercept form
Using y-intercept $(0,40)$, $y = -\frac{2}{3}x + 40$
Step4: Convert to standard form
Multiply all terms by 3: $3y = -2x + 120$, rearrange to $2x + 3y = 120$. Multiply by 4: $8x + 12y = 480$
Step5: Verify with intercepts
Substitute $(60,0)$: $8(60)+12(0)=480$, true. Substitute $(0,40)$: $8(0)+12(40)=480$, true.

Snap & solve any problem in the app
Get step-by-step solutions on Sovi AI
Photo-based solutions with guided steps
Explore more problems and detailed explanations
B) $8x + 12y = 480$