QUESTION IMAGE
Question
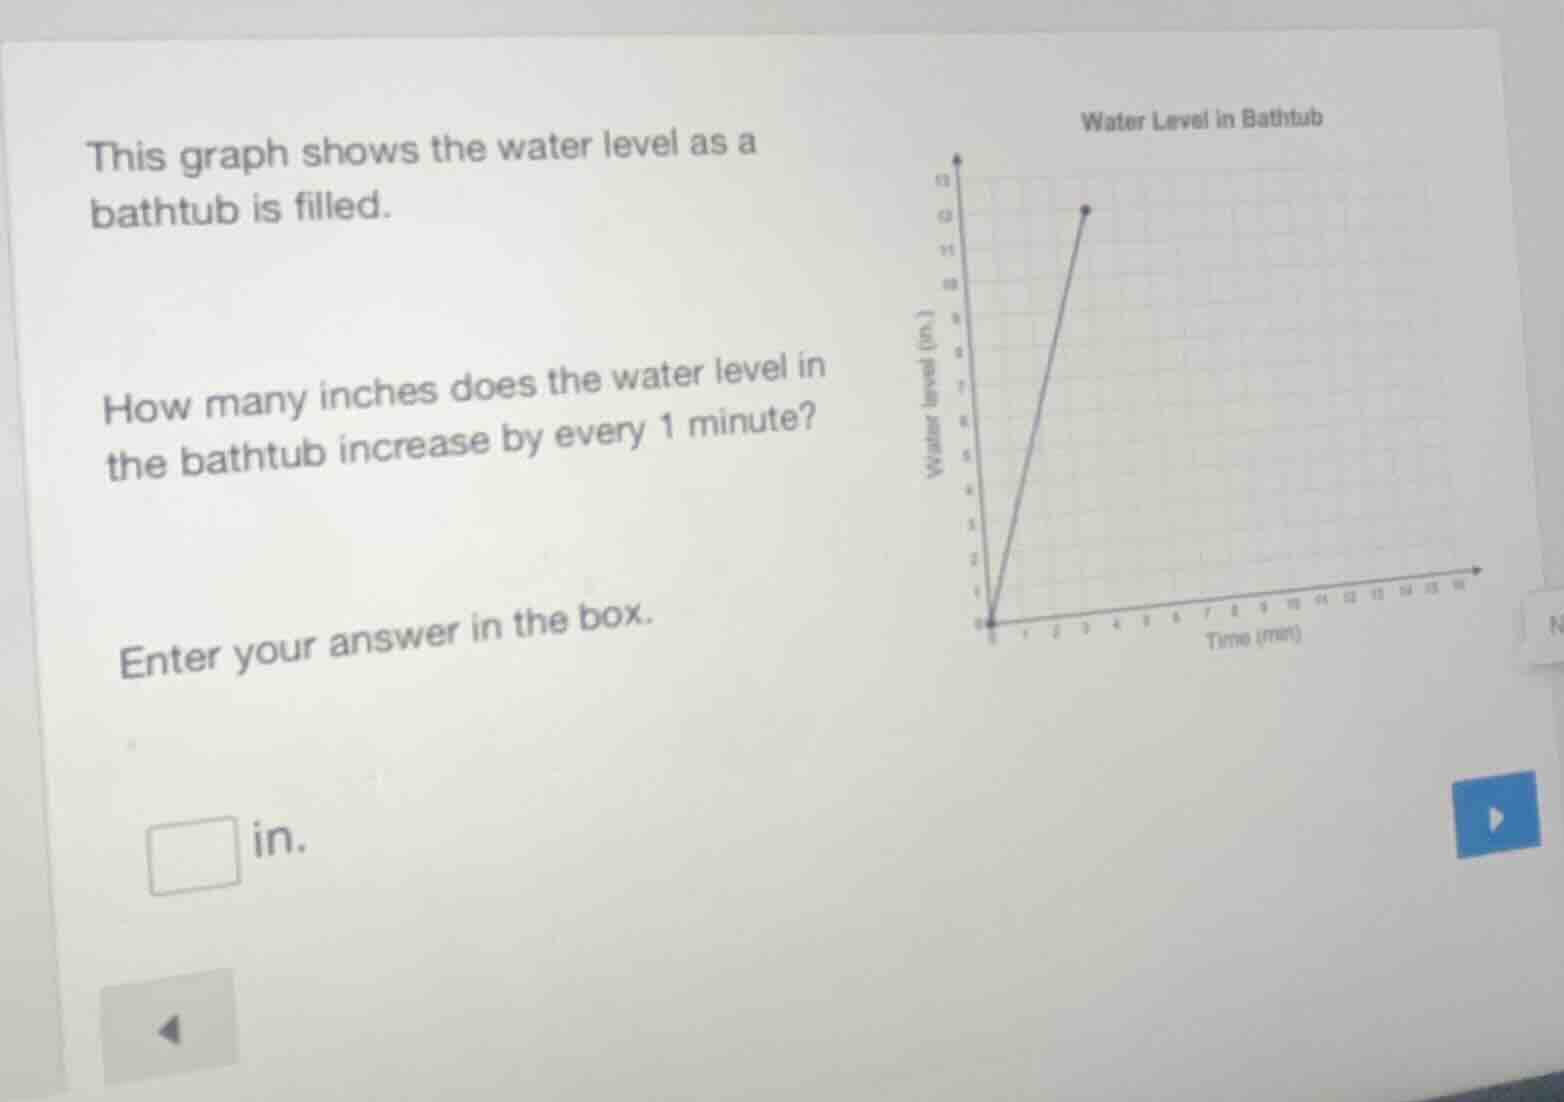
this graph shows the water level as a bathtub is filled. how many inches does the water level in the bathtub increase by every 1 minute? enter your answer in the box. \boxed{} in.
Step1: Identify coordinates from graph
From the graph, at \( t = 4 \) minutes, water level \( y = 12 \) inches (assuming the point is (4,12)).
Step2: Calculate rate of change
The rate of change (slope) is \( \frac{\text{Change in } y}{\text{Change in } t} \). So, \( \frac{12 - 0}{4 - 0} = \frac{12}{4} = 3 \).

Snap & solve any problem in the app
Get step-by-step solutions on Sovi AI
Photo-based solutions with guided steps
Explore more problems and detailed explanations
3