QUESTION IMAGE
Question
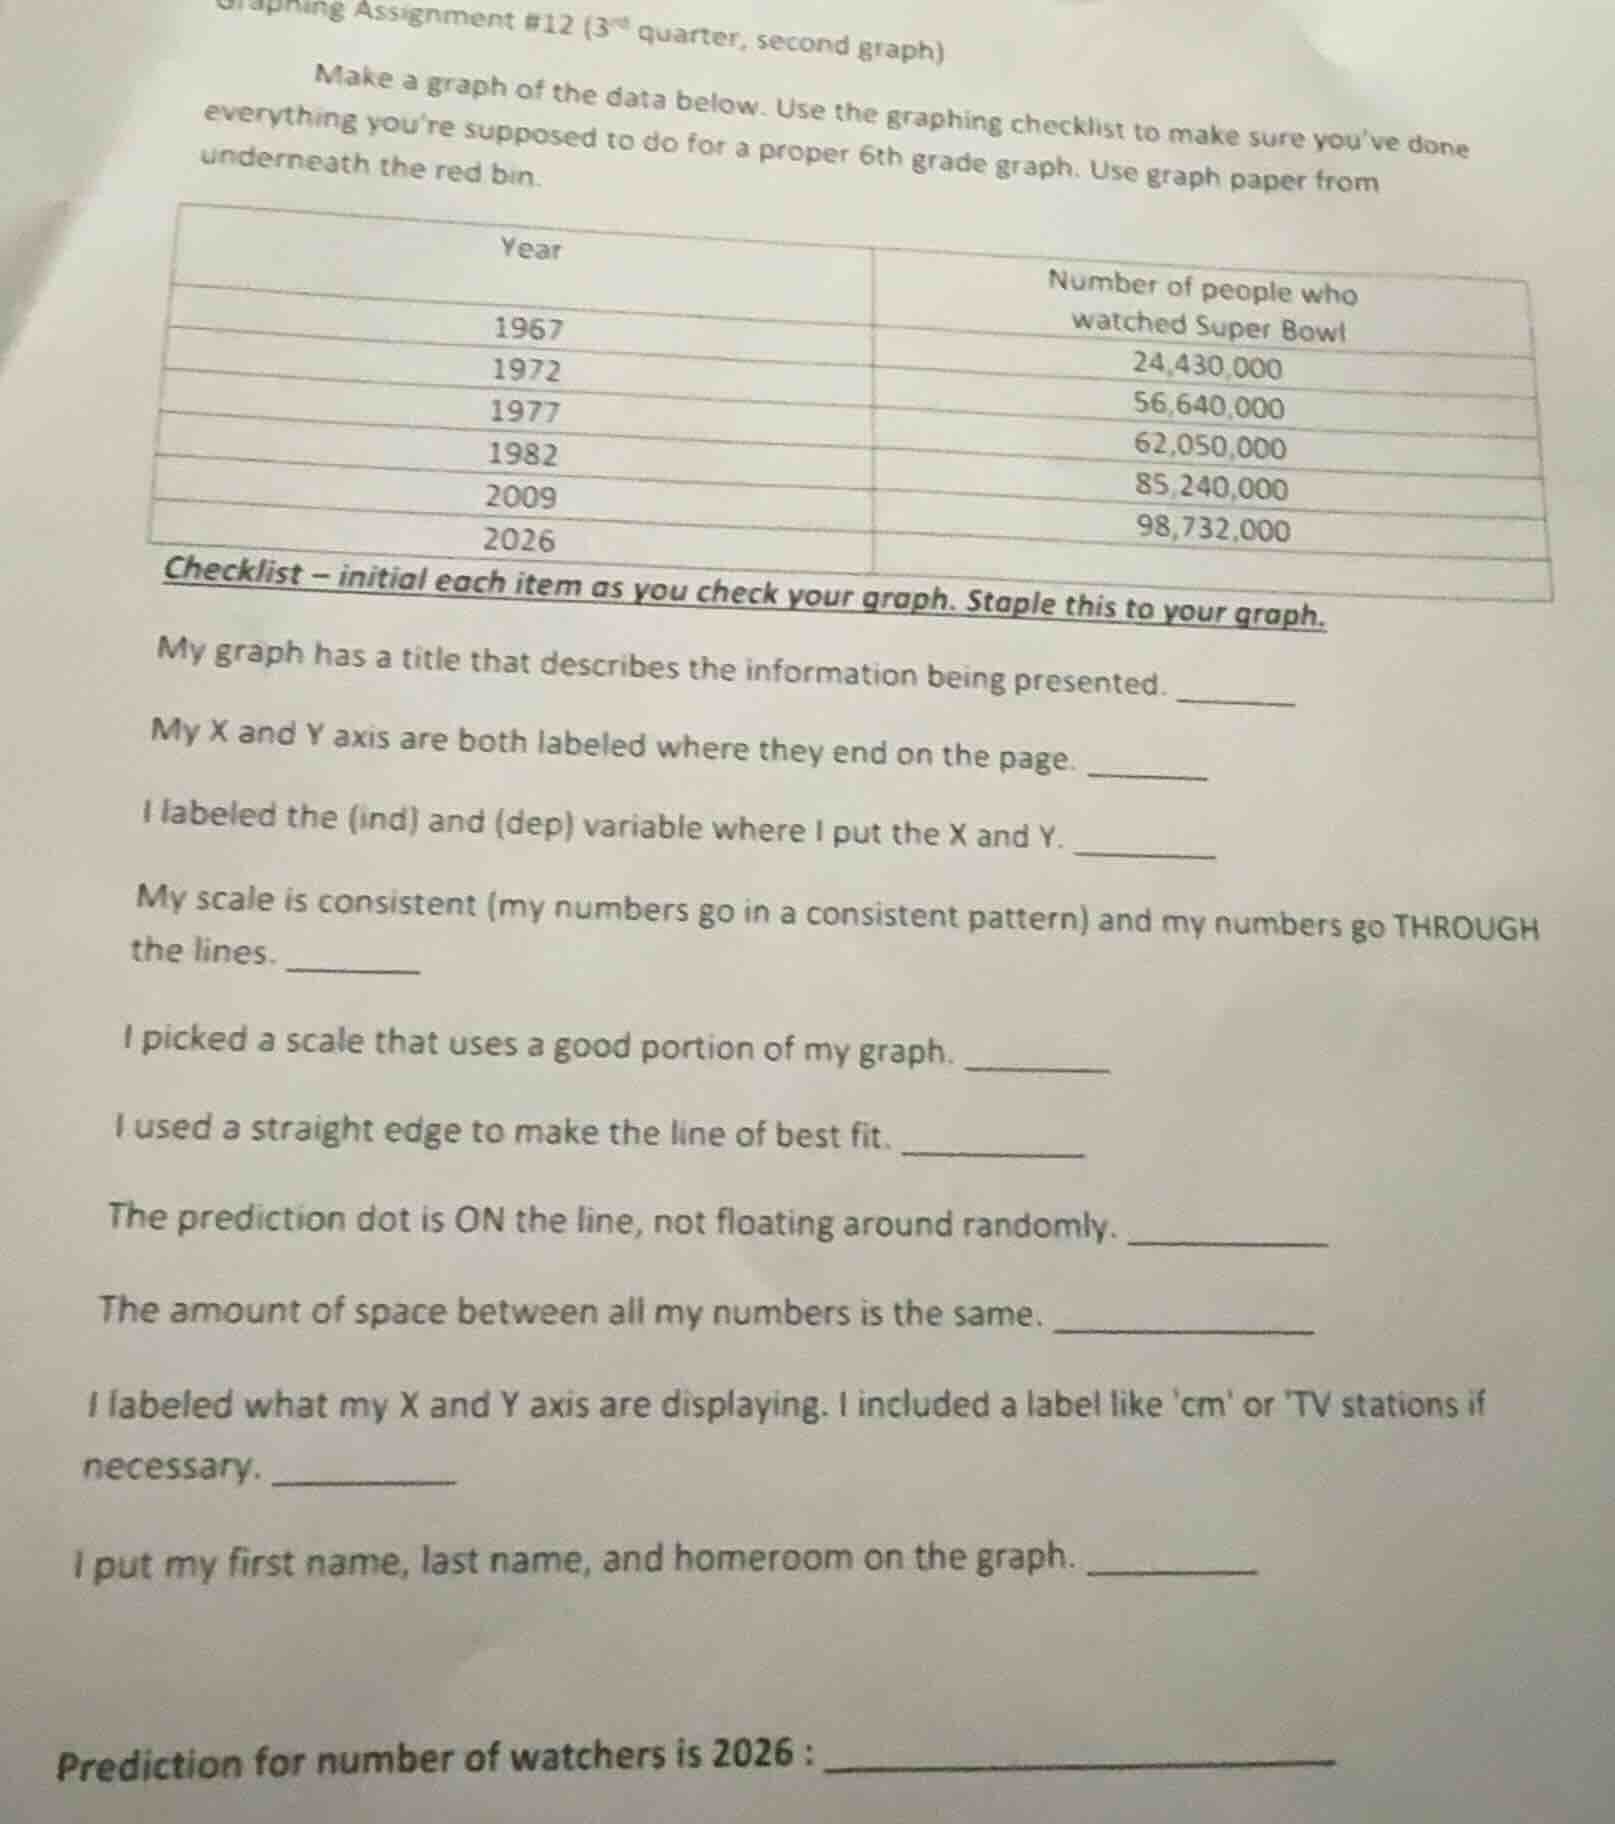
graphing assignment #12 (3rd quarter, second graph)
make a graph of the data below. use the graphing checklist to make sure youve done everything youre supposed to do for a proper 6th grade graph. use graph paper from underneath the red bin.
| year | number of people who watched super bowl |
|---|---|
| 1972 | 56,640,000 |
| 1977 | 62,050,000 |
| 1982 | 85,240,000 |
| 2009 | 98,732,000 |
| 2026 | (data in table) |
checklist – initial each item as you check your graph. staple this to your graph.
my graph has a title that describes the information being presented. ______
my x and y axis are both labeled where they end on the page. ______
i labeled the (ind) and (dep) variable where i put the x and y. ______
my scale is consistent (my numbers go in a consistent pattern) and my numbers go through the lines. ______
i picked a scale that uses a good portion of my graph. ______
i used a straight edge to make the line of best fit. ______
the prediction dot is on the line, not floating around randomly. ______
the amount of space between all my numbers is the same. ______
i labeled what my x and y axis are displaying. i included a label like cm or tv stations if necessary. ______
i put my first name, last name, and homeroom on the graph. ______
prediction for number of watchers in 2026: ______
Step1: Identify graph type & variables
Independent (X-axis): Year; Dependent (Y-axis): Number of Super Bowl viewers. A line graph is appropriate for showing trend over time.
Step2: Create axis labels & title
Title: Number of Super Bowl Viewers by Year
X-axis label: Year (Independent Variable)
Y-axis label: Number of Viewers (Dependent Variable, units: millions)
Step3: Set consistent scale
X-axis: Space years evenly (1967, 1972, 1977, 1982, 2009, 2026)
Y-axis: Use scale from 0 to 100,000,000 with intervals of 10,000,000 to fit all data.
Step4: Plot data points
Plot coordinates:
$(1967, 24430000)$, $(1972, 56640000)$, $(1977, 62050000)$, $(1982, 85240000)$, $(2009, 98732000)$
Step5: Add line of best fit
Draw a straight line through/near plotted points, extending to 2026.
Step6: Verify checklist items
Confirm all checklist requirements are met (title, axis labels, consistent scale, line of best fit, etc.).
Step7: Get 2026 prediction
The given data already provides the 2026 value: $98,732,000$

Snap & solve any problem in the app
Get step-by-step solutions on Sovi AI
Photo-based solutions with guided steps
Explore more problems and detailed explanations
Graph Requirements Summary:
- Title: Number of Super Bowl Viewers by Year
- X-axis (Independent): Labeled "Year", with evenly spaced years: 1967, 1972, 1977, 1982, 2009, 2026
- Y-axis (Dependent): Labeled "Number of Viewers (millions)", with a consistent scale from 0 to 100,000,000 (interval of 10,000,000)
- Plotted data points, a straight line of best fit, and all checklist items completed
2026 Viewer Prediction:
98,732,000