QUESTION IMAGE
Question
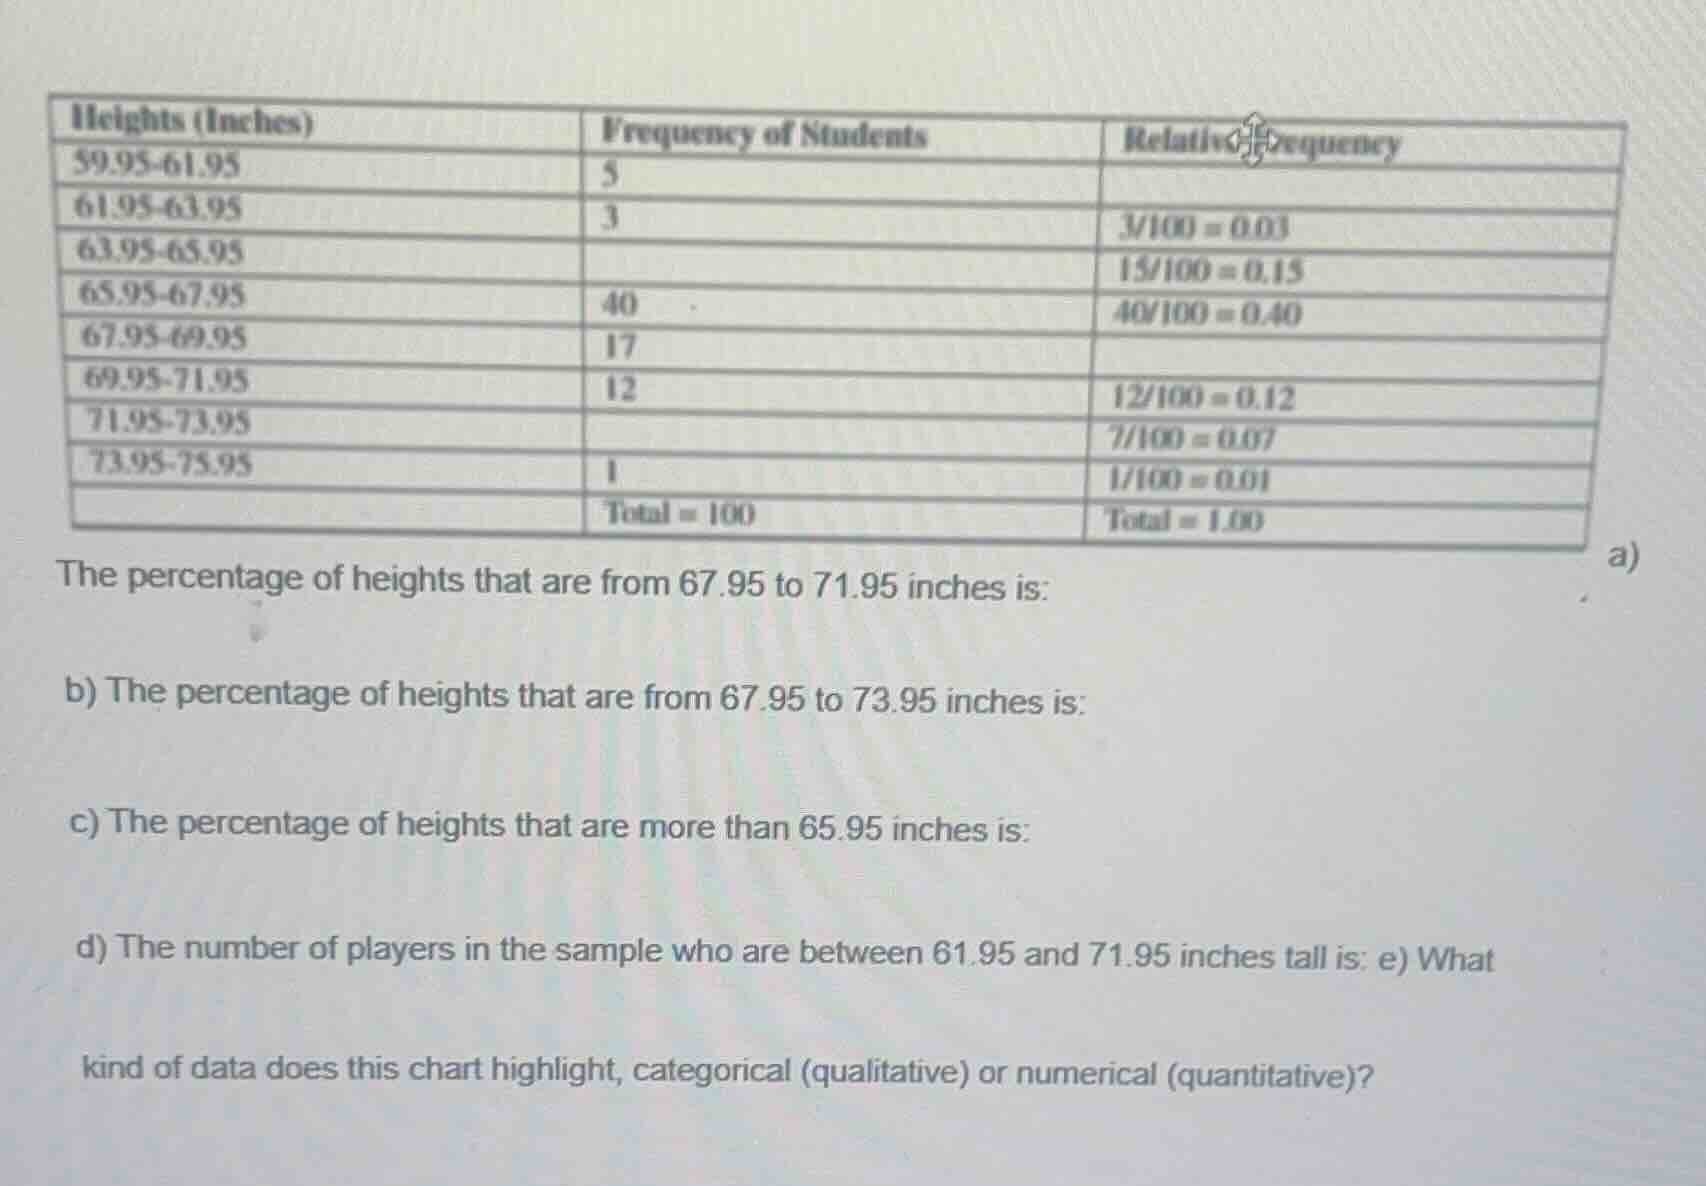
heights (inches) | frequency of students | relative frequency
59.95-61.95 | 5 |
61.95-63.95 | 3 | $\frac{3}{100}=0.03$
63.95-65.95 | | $\frac{15}{100}=0.15$
65.95-67.95 | 40 | $\frac{40}{100}=0.40$
67.95-69.95 | 17 |
69.95-71.95 | 12 | $\frac{12}{100}=0.12$
71.95-73.95 | | $\frac{7}{100}=0.07$
73.95-75.95 | 1 | $\frac{1}{100}=0.01$
| total = 100 | total = 1.00
a) the percentage of heights that are from 67.95 to 71.95 inches is:
b) the percentage of heights that are from 67.95 to 73.95 inches is:
c) the percentage of heights that are more than 65.95 inches is:
d) the number of players in the sample who are between 61.95 and 71.95 inches tall is:
e) what kind of data does this chart highlight, categorical (qualitative) or numerical (quantitative)?
Step1: Sum relevant relative frequencies (a)
Add relative frequencies for 67.95-69.95 and 69.95-71.95:
$0.17 + 0.12 = 0.29$
Convert to percentage: $0.29 \times 100 = 29\%$
Step2: Sum relevant relative frequencies (b)
Add relative frequencies for 67.95-69.95, 69.95-71.95, 71.95-73.95:
$0.17 + 0.12 + 0.07 = 0.36$
Convert to percentage: $0.36 \times 100 = 36\%$
Step3: Sum relevant relative frequencies (c)
Add relative frequencies for intervals >65.95:
$0.40 + 0.17 + 0.12 + 0.07 + 0.01 = 0.77$
Convert to percentage: $0.77 \times 100 = 77\%$
Step4: Sum relevant frequencies (d)
Add frequencies for 61.95-63.95 to 69.95-71.95:
$3 + 15 + 40 + 17 + 12 = 87$
Step5: Identify data type (e)
Heights are numerical measurements, so quantitative.

Snap & solve any problem in the app
Get step-by-step solutions on Sovi AI
Photo-based solutions with guided steps
Explore more problems and detailed explanations
a) 29%
b) 36%
c) 77%
d) 87
e) Numerical (quantitative)