QUESTION IMAGE
Question
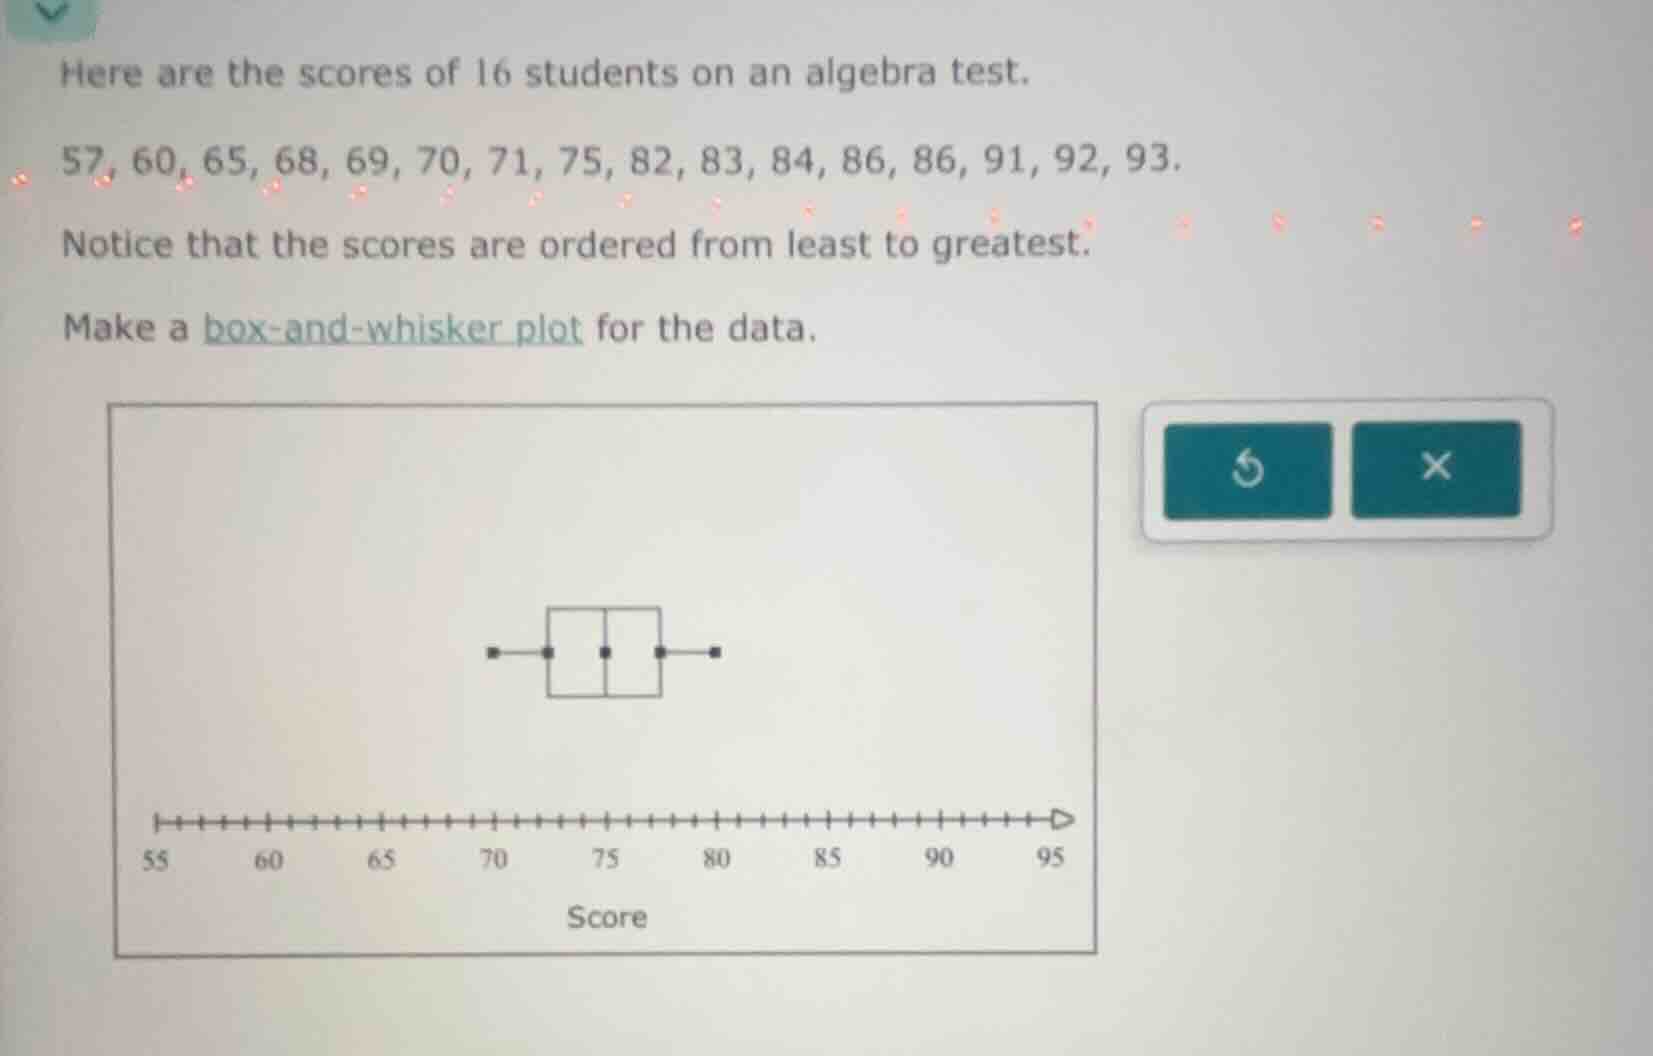
here are the scores of 16 students on an algebra test.
57, 60, 65, 68, 69, 70, 71, 75, 82, 83, 84, 86, 86, 91, 92, 93.
notice that the scores are ordered from least to greatest.
make a box - and - whisker plot for the data.
Step1: Find minimum value
Minimum = 57
Step2: Find maximum value
Maximum = 93
Step3: Calculate median (Q2)
For $n=16$, median is average of 8th and 9th values:
$\text{Median} = \frac{75 + 82}{2} = 78.5$
Step4: Calculate Q1 (lower quartile)
Q1 is median of first 8 values:
$\text{Q1} = \frac{65 + 68}{2} = 66.5$
Step5: Calculate Q3 (upper quartile)
Q3 is median of last 8 values:
$\text{Q3} = \frac{86 + 86}{2} = 86$
Step6: Plot the 5-number summary
- Left whisker end: 57
- Left box edge: 66.5
- Box middle line: 78.5
- Right box edge: 86
- Right whisker end: 93

Snap & solve any problem in the app
Get step-by-step solutions on Sovi AI
Photo-based solutions with guided steps
Explore more problems and detailed explanations
The box-and-whisker plot is constructed with the following key points aligned to the score axis:
- Minimum (left whisker): 57
- Lower Quartile (Q1, left box boundary): 66.5
- Median (box center line): 78.5
- Upper Quartile (Q3, right box boundary): 86
- Maximum (right whisker): 93