QUESTION IMAGE
Question
homework
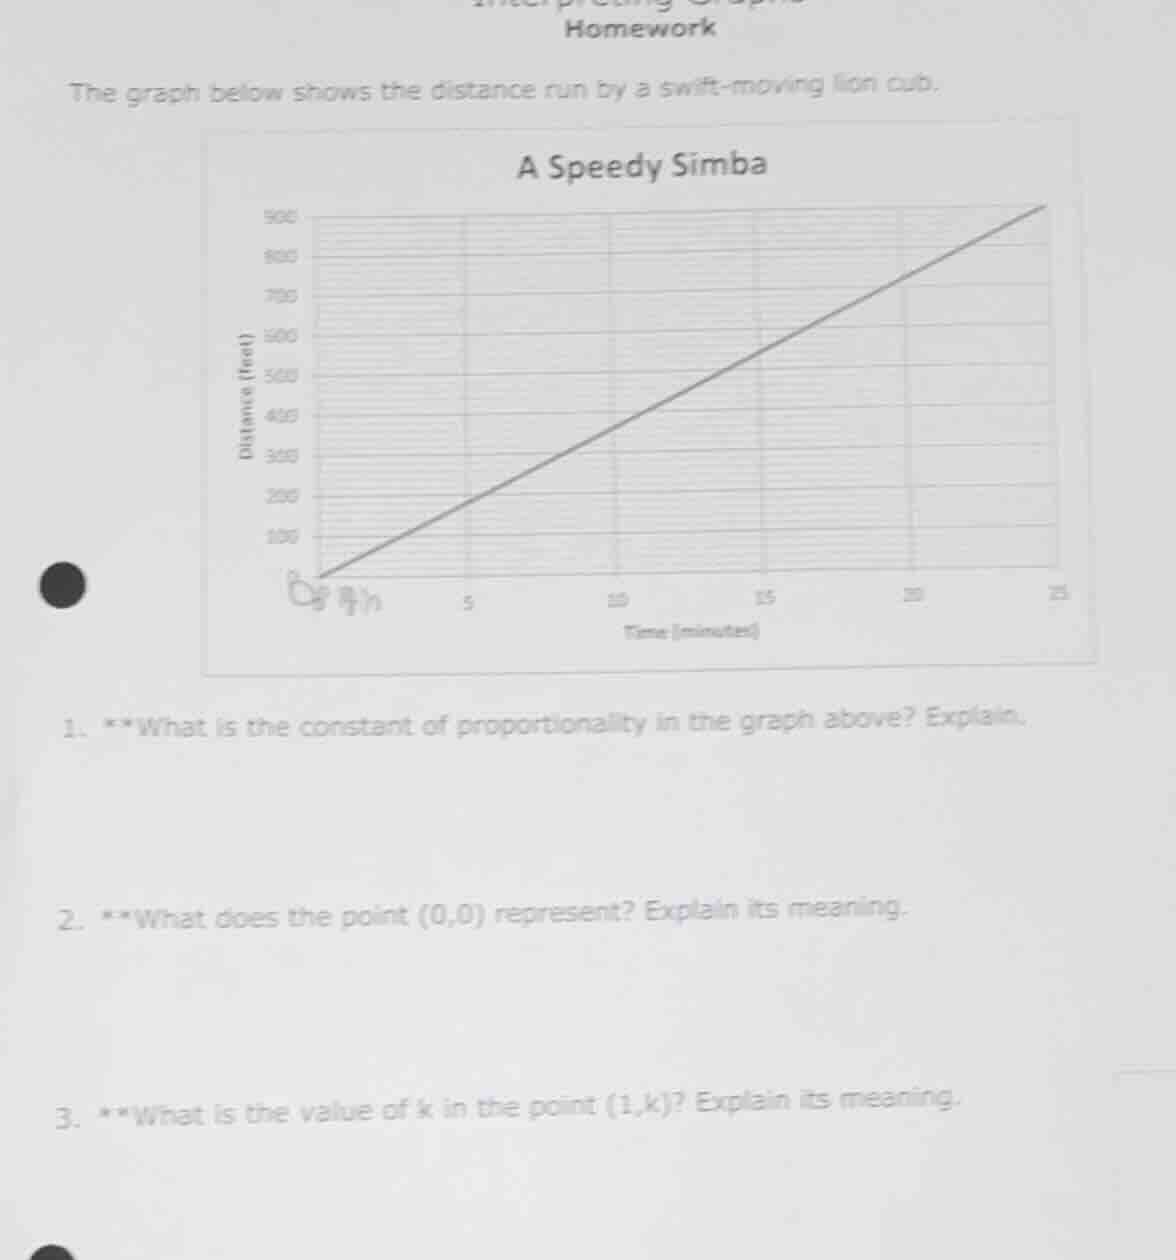
the graph below shows the distance run by a swift - moving lion cub.
a speedy simba
- **what is the constant of proportionality in the graph above? explain.
- **what does the point (0,0) represent? explain its meaning.
- **what is the value of k in the point (1,k)? explain its meaning.
Step1: Identify proportional relationship
The graph shows distance \(d\) (feet) vs. time \(t\) (minutes), a proportional relationship \(d = kt\), where \(k\) is the constant of proportionality.
Step2: Calculate k using graph points
Pick a clear point, e.g., \(t=10\) min, \(d=400\) ft.
\(k = \frac{d}{t} = \frac{400}{10} = 40\)
Step3: Interpret (0,0) point
The point \((0,0)\) means \(t=0\) minutes, \(d=0\) feet.
Step4: Find k in (1,k)
Use \(k=40\), so the point is \((1,40)\).

Snap & solve any problem in the app
Get step-by-step solutions on Sovi AI
Photo-based solutions with guided steps
Explore more problems and detailed explanations
- The constant of proportionality is 40. This is calculated by dividing distance by time (e.g., 400 feet / 10 minutes = 40), representing the lion cub's speed in feet per minute.
- The point (0,0) represents that at 0 minutes (the start), the lion cub has run 0 feet. It is the starting point of the cub's run.
- The value of \(k\) is 40. This means that in 1 minute, the lion cub runs 40 feet, which is the cub's constant speed.