QUESTION IMAGE
Question
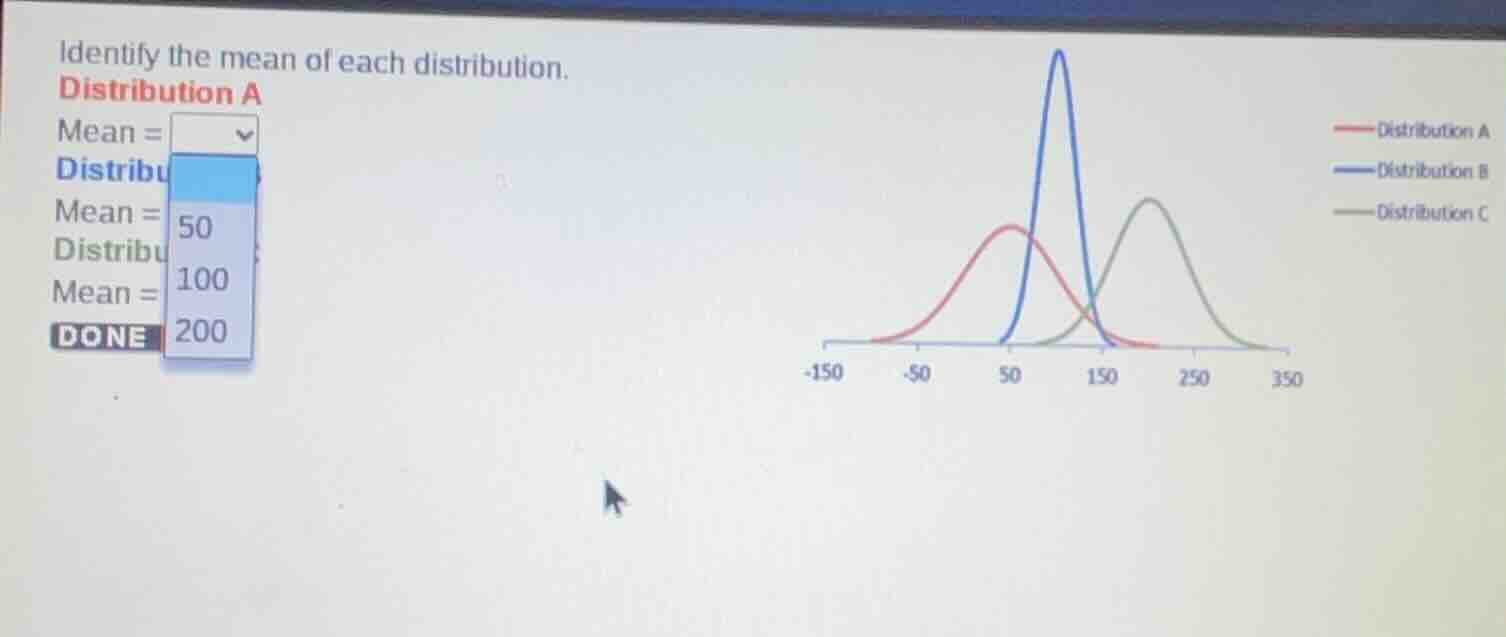
identify the mean of each distribution. distribution a mean = distribution b mean = distribution c mean = done
Step1: Locate Distribution A peak
The red curve (Distribution A) has its peak centered at $50$. For a normal distribution, the mean equals the peak (center) value.
Step2: Locate Distribution B peak
The blue curve (Distribution B) has its peak centered at $100$. For a normal distribution, the mean equals the peak (center) value.
Step3: Locate Distribution C peak
The gray curve (Distribution C) has its peak centered at $200$. For a normal distribution, the mean equals the peak (center) value.

Snap & solve any problem in the app
Get step-by-step solutions on Sovi AI
Photo-based solutions with guided steps
Explore more problems and detailed explanations
Distribution A Mean = 50
Distribution B Mean = 100
Distribution C Mean = 200