QUESTION IMAGE
Question
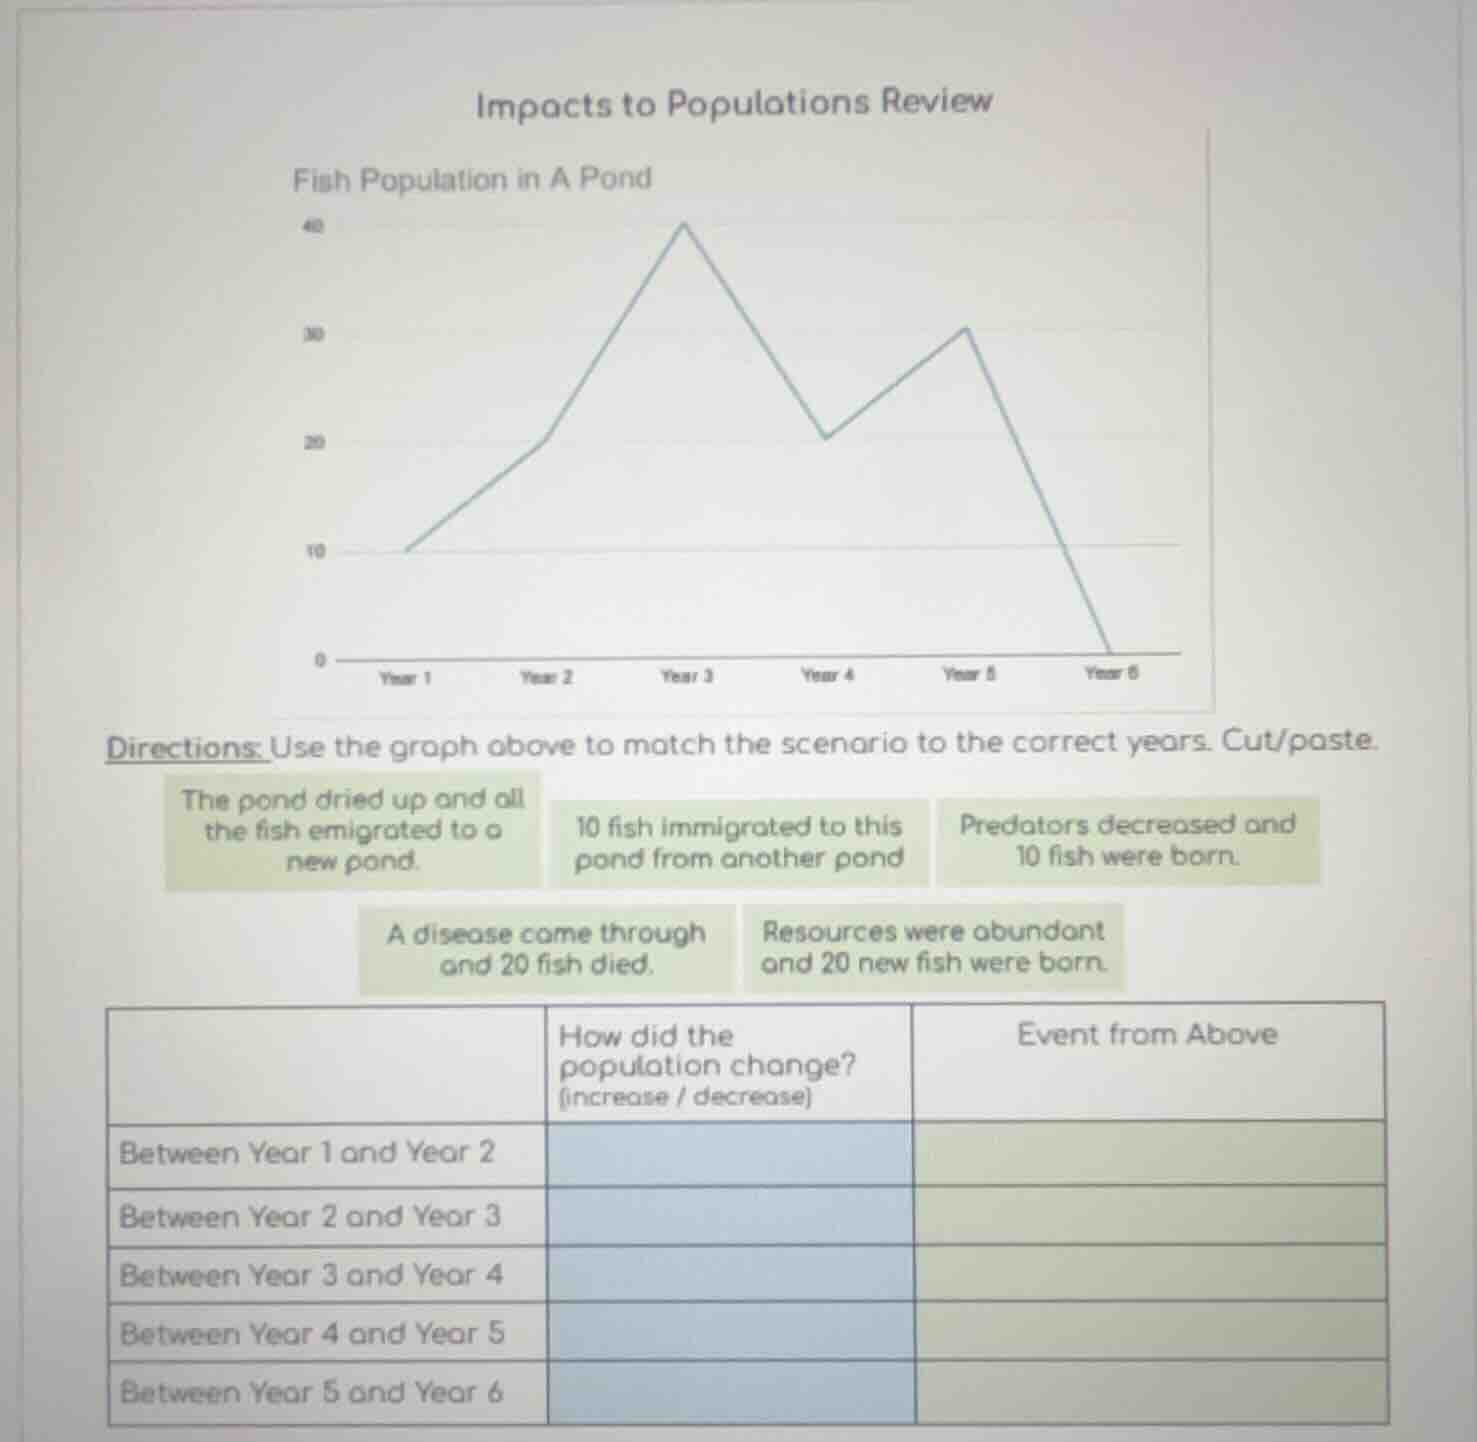
impacts to populations review
fish population in a pond
directions: use the graph above to match the scenario to the correct years. cut/paste.
the pond dried up and all the fish emigrated to a new pond.
10 fish immigrated to this pond from another pond
predators decreased and 10 fish were born.
a disease came through and 20 fish died.
resources were abundant and 20 new fish were born.
| how did the population change? (increase / decrease) | event from above | --- | --- | --- | between year 1 and year 2 | between year 2 and year 3 | between year 3 and year 4 | between year 4 and year 5 | between year 5 and year 6 |
Brief Explanations
- Year 1 to Year 2: The population rises from 10 to 20 (a 10-fish increase). This matches the scenario of 10 fish immigrating or 10 being born; the 10-fish immigration is the direct 10-unit increase match.
- Year 2 to Year 3: The population jumps from 20 to 40 (a 20-fish increase). This aligns with abundant resources causing 20 new fish to be born.
- Year 3 to Year 4: The population drops from 40 to 20 (a 20-fish decrease). This matches a disease killing 20 fish.
- Year 4 to Year 5: The population rises from 20 to 30 (a 10-fish increase). This fits the scenario of fewer predators leading to 10 fish being born.
- Year 5 to Year 6: The population drops from 30 to 0 (total loss). This matches the pond drying up and all fish emigrating.

Snap & solve any problem in the app
Get step-by-step solutions on Sovi AI
Photo-based solutions with guided steps
Explore more problems and detailed explanations
| Time Period | How did the population change? (increase / decrease) | Event from Above |
|---|---|---|
| Between Year 2 and Year 3 | Increase | Resources were abundant and 20 new fish were born. |
| Between Year 3 and Year 4 | Decrease | A disease came through and 20 fish died. |
| Between Year 4 and Year 5 | Increase | Predators decreased and 10 fish were born. |
| Between Year 5 and Year 6 | Decrease | The pond dried up and all the fish emigrated to a new pond. |