QUESTION IMAGE
Question
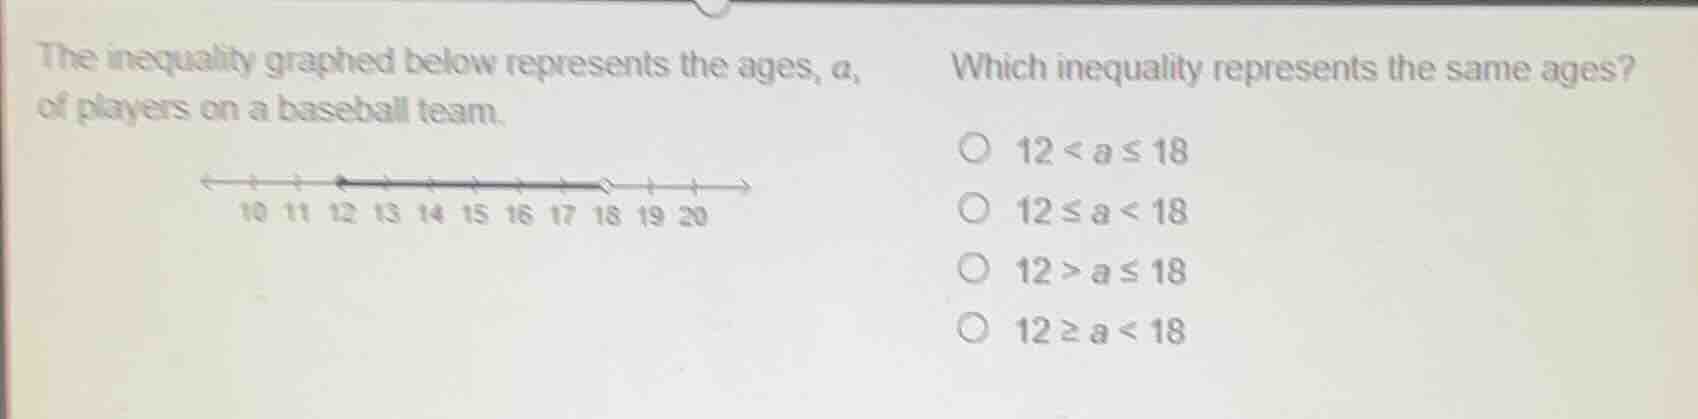
the inequality graphed below represents the ages, a, of players on a baseball team. which inequality represents the same ages? 10 11 12 13 14 15 16 17 18 19 20 12 < a ≤ 18 12 ≤ a < 18 12 > a ≤ 18 12 ≥ a < 18
Step1: Analyze left endpoint
The graph has a closed dot at 12, meaning $a$ includes 12, so $12 \leq a$.
Step2: Analyze right endpoint
The graph has an open dot at 18, meaning $a$ does not include 18, so $a < 18$.
Step3: Combine inequalities
Merge the two conditions into one inequality.

Snap & solve any problem in the app
Get step-by-step solutions on Sovi AI
Photo-based solutions with guided steps
Explore more problems and detailed explanations
12 ≤ a < 18