QUESTION IMAGE
Question
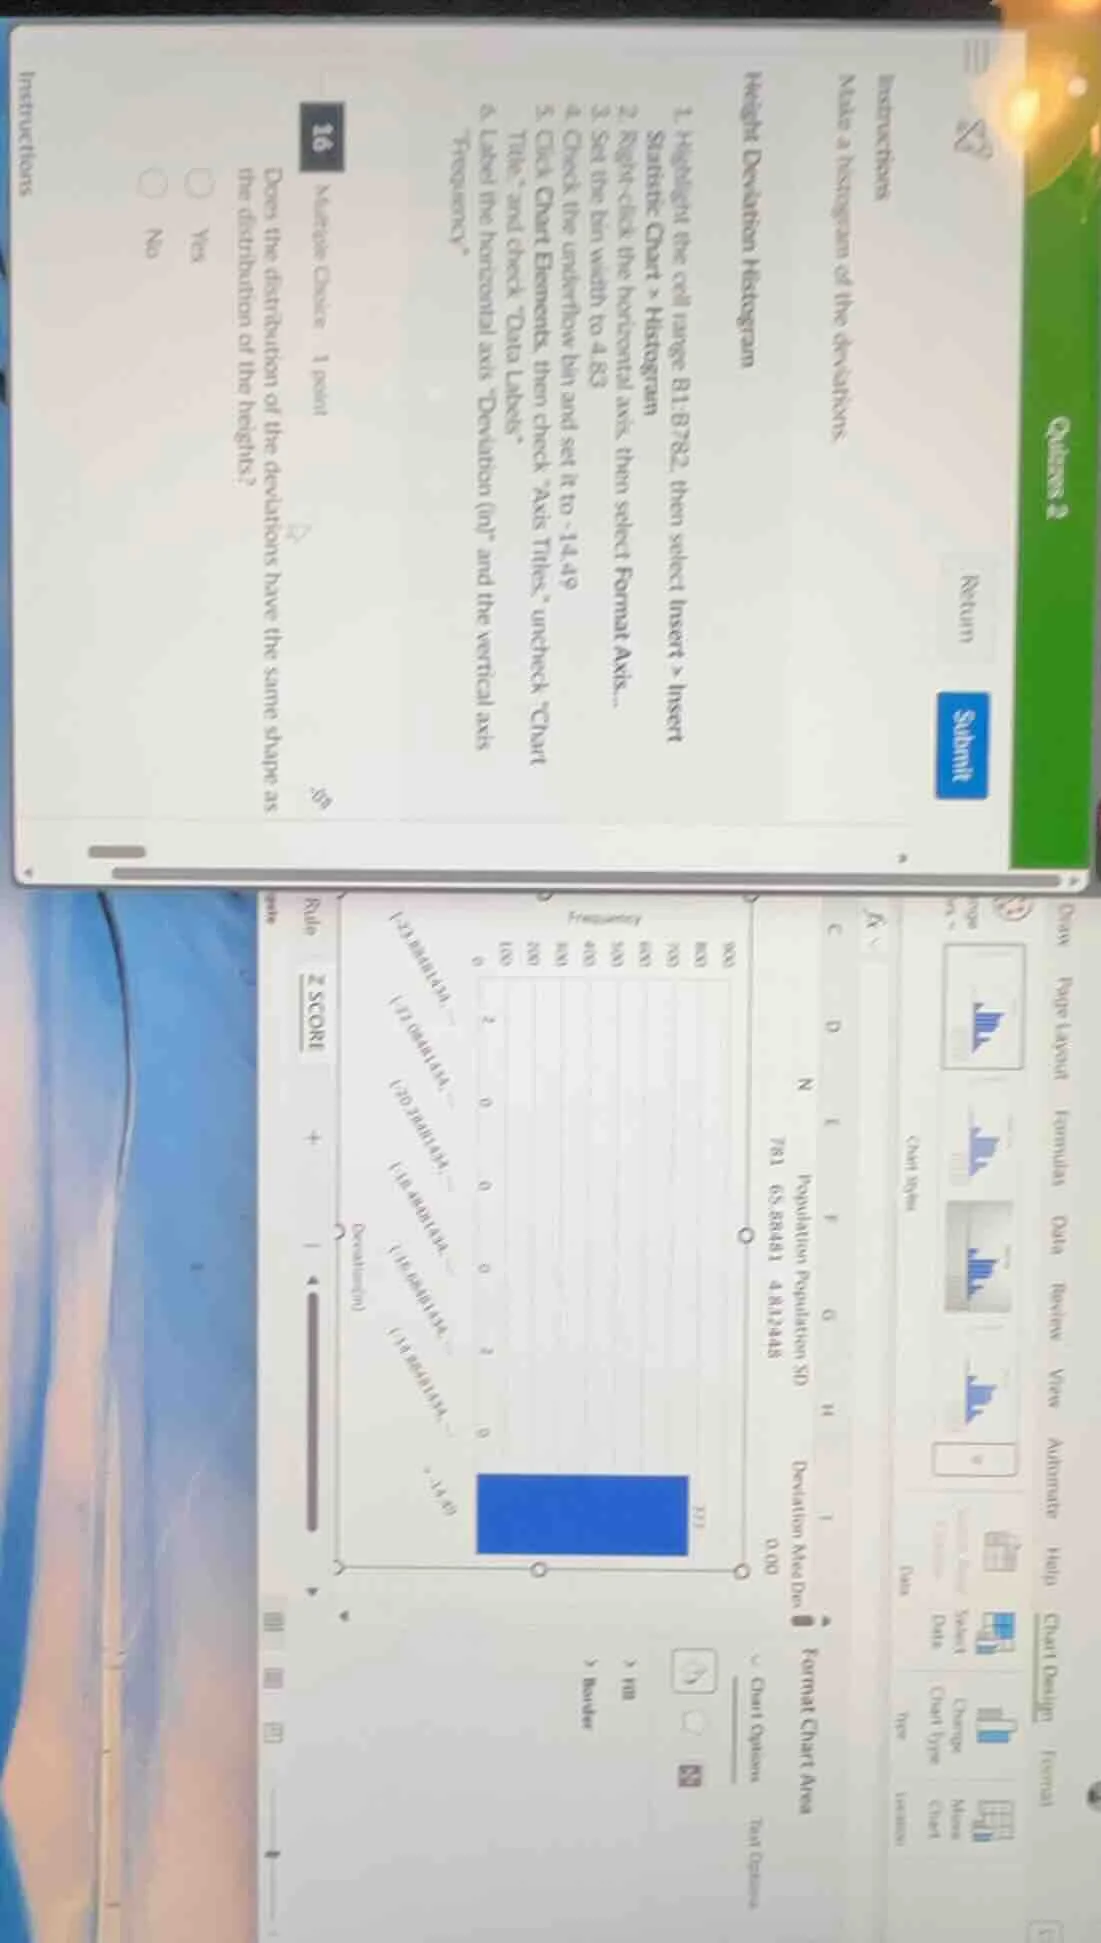
instructions
make a histogram of the deviations.
height deviation histogram
- highlight the cell range b1:b782, then select insert > insert statistic chart > histogram
- right - click the horizontal axis, then select format axis...
- set the bin width to 4.83
- check the overflow bin and set it to - 14.49
- click chart elements, then check “axis titles”, uncheck “chart title”, and check “data labels”.
- label the horizontal axis “deviation (in)” and the vertical axis “frequency”.
16 multiple choice 1 point
does the distribution of the deviations have the same shape as the distribution of the heights?
yes
no
Brief Explanations
Deviations from a mean are calculated by subtracting the mean from each data point, which essentially shifts the original distribution (heights) so its center is at 0, but does not change the shape of the distribution. The histogram of deviations will have the same spread and shape as the original height distribution, just a different center.

Snap & solve any problem in the app
Get step-by-step solutions on Sovi AI
Photo-based solutions with guided steps
Explore more problems and detailed explanations
Yes