QUESTION IMAGE
Question
interpreting a circle graph or pie chart
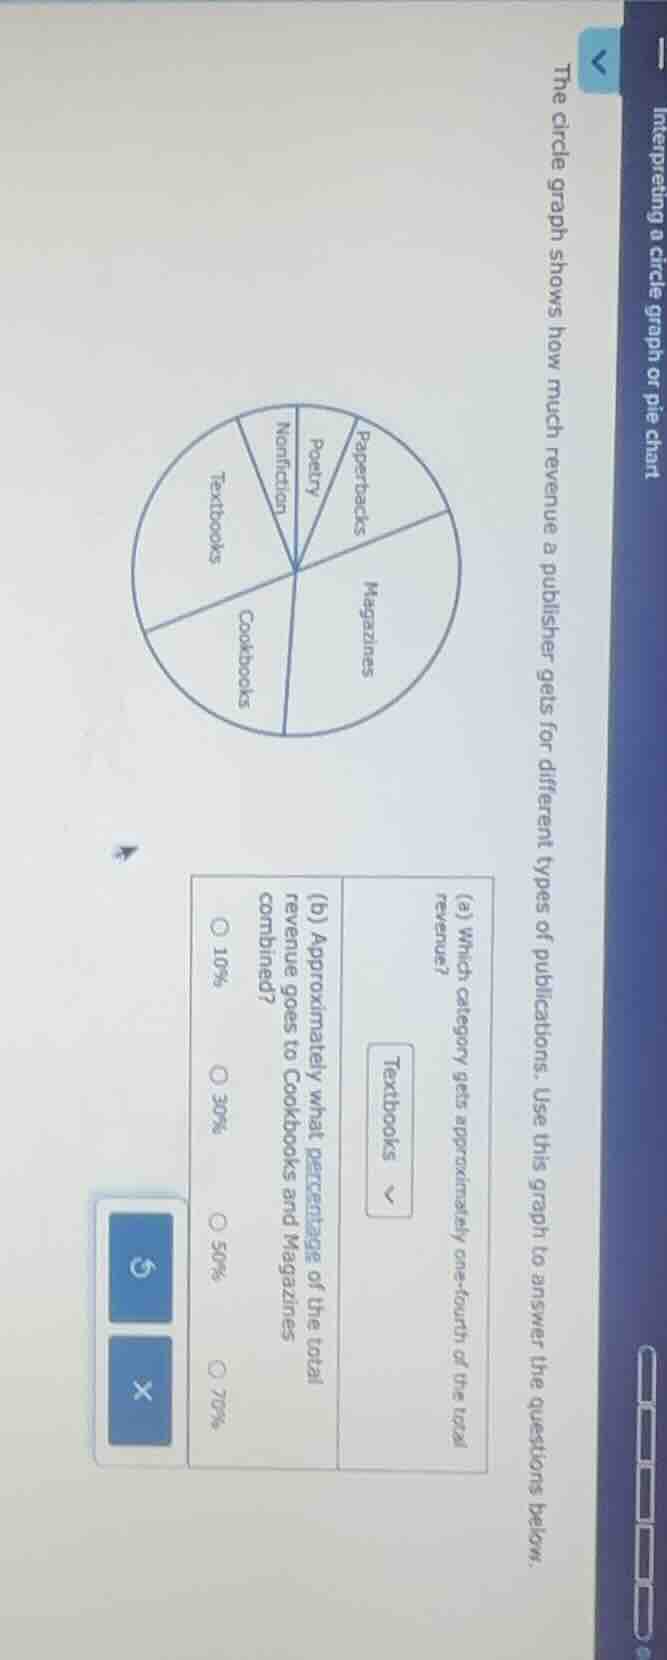
the circle graph shows how much revenue a publisher gets for different types of publications. use this graph to answer the questions below.
(a) which category gets approximately one - fourth of the total revenue?
textbooks
(b) approximately what percentage of the total revenue goes to cookbooks and magazines combined?
10%
30%
50%
70%
Part (a)
Step1: Recall one - fourth as a percentage
One - fourth is equivalent to $\frac{1}{4}$, and $\frac{1}{4}=0.25 = 25\%$. We need to find which category in the pie chart (circle graph) has a sector that is approximately $\frac{1}{4}$ (or 25%) of the whole circle.
Looking at the pie chart, the "Magazines" sector seems to be approximately a quarter of the circle. The "Textbooks" sector: if we compare, the "Magazines" sector is more likely to be around 25% (one - fourth) as it looks like a quarter - circle segment.
Step2: Confirm by visual inspection
A full circle is $360^{\circ}$. One - fourth of $360^{\circ}$ is $90^{\circ}$. The "Magazines" sector appears to be approximately a right - angled (90 - degree) sector, which is one - fourth of the circle. The other sectors: "Paperbacks" is smaller, "Textbooks" is less than a quarter, "Cookbooks" is less, and the smaller sectors (Poetry, Nonfiction) are much smaller. So the category that gets approximately one - fourth of the total revenue is Magazines.
Part (b)
Step1: Analyze the sectors for Cookbooks and Magazines
First, we estimate the percentage of each sector. The "Magazines" sector is approximately 25% (as in part a). The "Cookbooks" sector: looking at the pie chart, it seems to be about 25% as well? Wait, no. Wait, the "Magazines" is about a quarter (25%), "Cookbooks" - let's see, the "Textbooks" and "Cookbooks" and "Magazines" and "Paperbacks" and others. Wait, actually, when we look at "Cookbooks" and "Magazines" combined. "Magazines" is ~25%, "Cookbooks" - let's see, the "Textbooks" is a segment, "Cookbooks" is a segment that, when combined with "Magazines", let's estimate. "Magazines" is ~25%, "Cookbooks" - let's say "Cookbooks" is about 25%? No, wait, the options are 10%, 30%, 50%, 70%. Wait, maybe my initial estimate was wrong. Wait, the "Magazines" sector is a large segment, maybe around 30 - 40%, and "Cookbooks" is around 20 - 30%? Wait, no, the combined percentage: if "Magazines" is about 30% and "Cookbooks" is about 20%, combined is 50%? Wait, no, the options include 50%. Wait, let's re - examine. The "Magazines" sector is a significant portion, and "Cookbooks" is another. When we add them, the combined area of "Cookbooks" and "Magazines" looks like about half (50%) of the pie chart. Let's check the options: 10% is too small, 30% is too small, 70% is too big, so 50% is the best estimate.
Step2: Final check
The "Magazines" sector and "Cookbooks" sector, when combined, visually appear to cover about half of the pie chart. So the approximate percentage of the total revenue that goes to Cookbooks and Magazines combined is 50%.

Snap & solve any problem in the app
Get step-by-step solutions on Sovi AI
Photo-based solutions with guided steps
Explore more problems and detailed explanations
(a): Magazines