QUESTION IMAGE
Question
interpreting graphs
homework
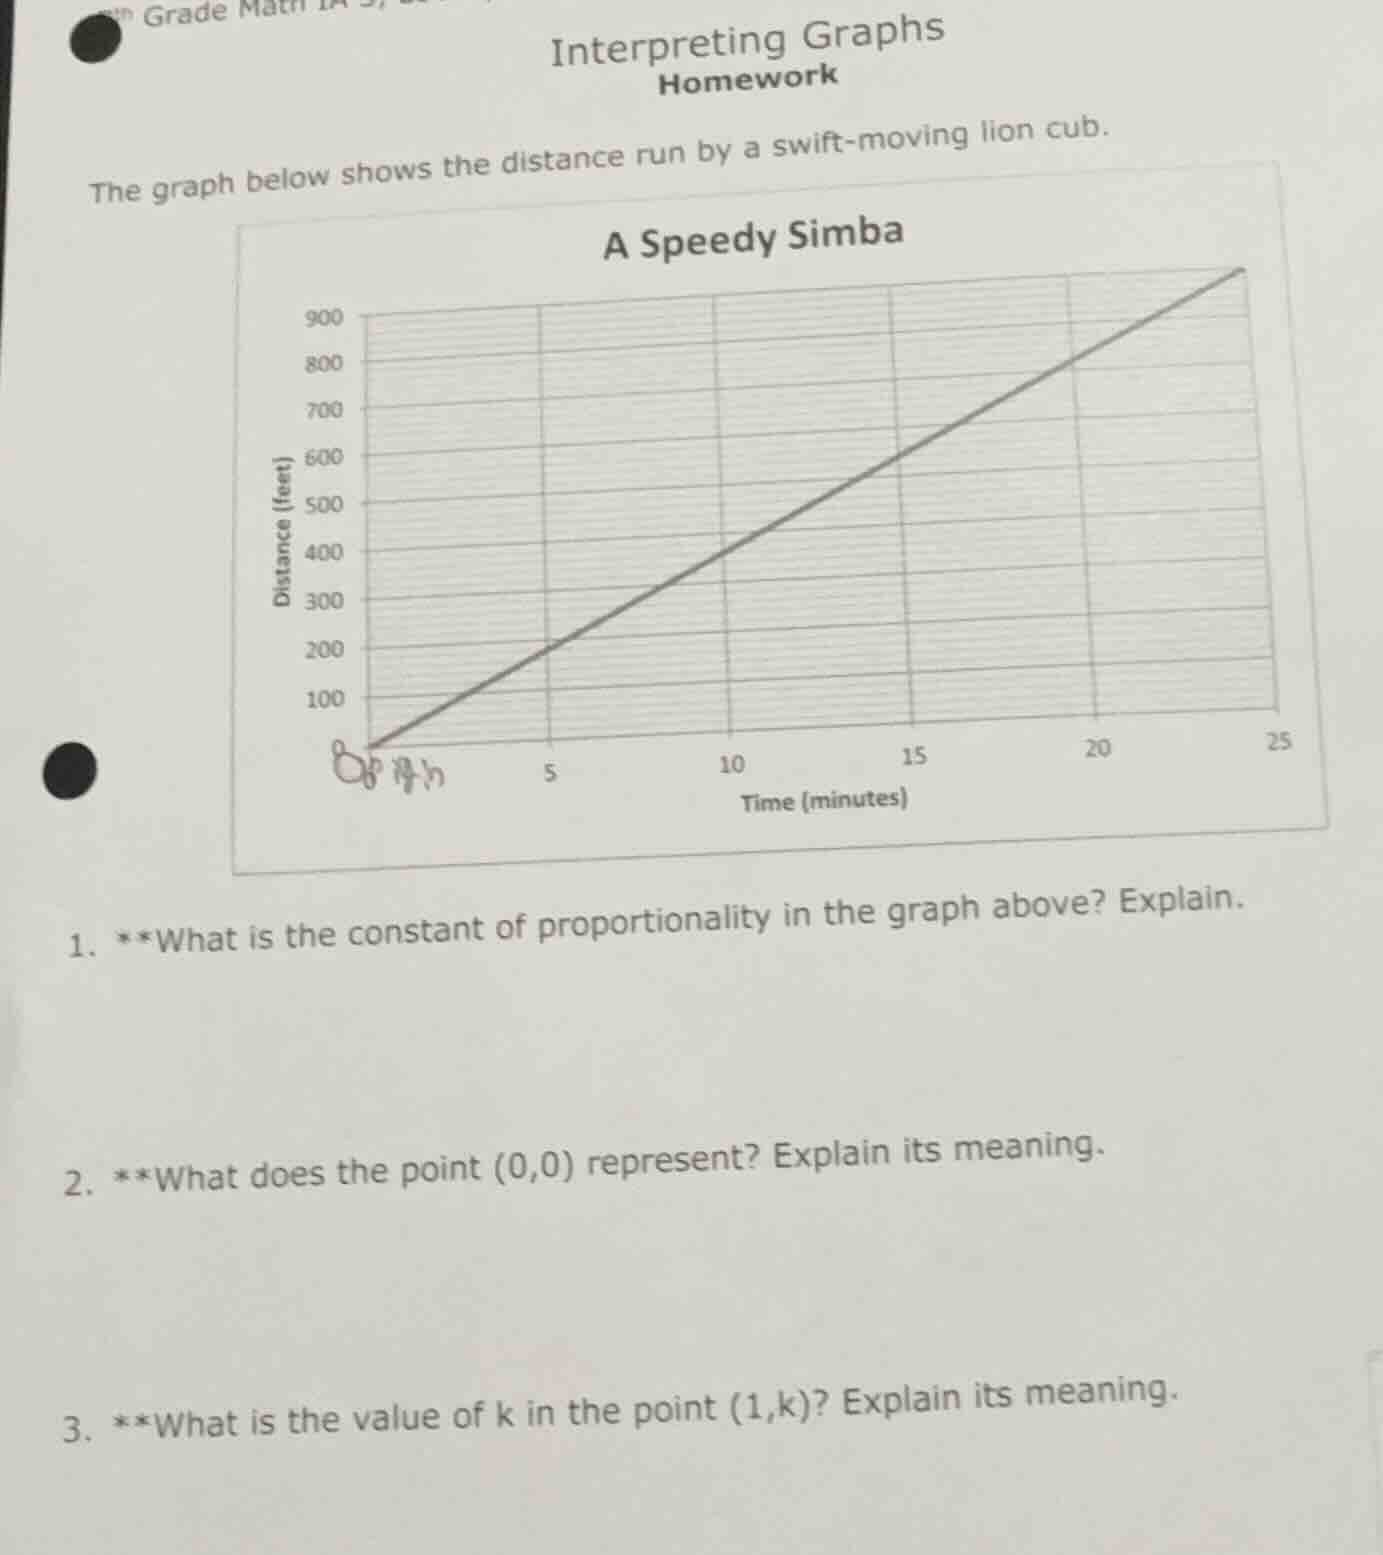
the graph below shows the distance run by a swift-moving lion cub.
a speedy simba
900
800
700
600
500
400
300
200
100
0
5
10
15
20
25
time (minutes)
distance (feet)
- **what is the constant of proportionality in the graph above? explain.
- **what does the point (0,0) represent? explain its meaning.
- **what is the value of k in the point (1,k)? explain its meaning.
Step1: Identify proportionality formula
For a proportional relationship between distance $d$ and time $t$, $d = kt$, where $k$ is the constant of proportionality.
Step2: Use graph point to find $k$
Pick a clear point, e.g., $(20, 800)$. Substitute into $k=\frac{d}{t}$:
$k=\frac{800}{20}=40$
Step3: Interpret (0,0)
The point $(0,0)$ has $t=0$ minutes, $d=0$ feet.
Step4: Find $k$ for (1,k)
Since $k=40$, the point is $(1,40)$. This is the distance per 1 minute.

Snap & solve any problem in the app
Get step-by-step solutions on Sovi AI
Photo-based solutions with guided steps
Explore more problems and detailed explanations
- The constant of proportionality is 40. It is calculated by dividing distance by time (e.g., $\frac{800}{20}=40$), representing the lion cub's speed in feet per minute.
- The point (0,0) represents that at 0 minutes (the start), the lion cub has run 0 feet.
- The value of $k$ is 40. This means the lion cub runs 40 feet in 1 minute, which is its constant speed.