QUESTION IMAGE
Question
interpreting slope from a table
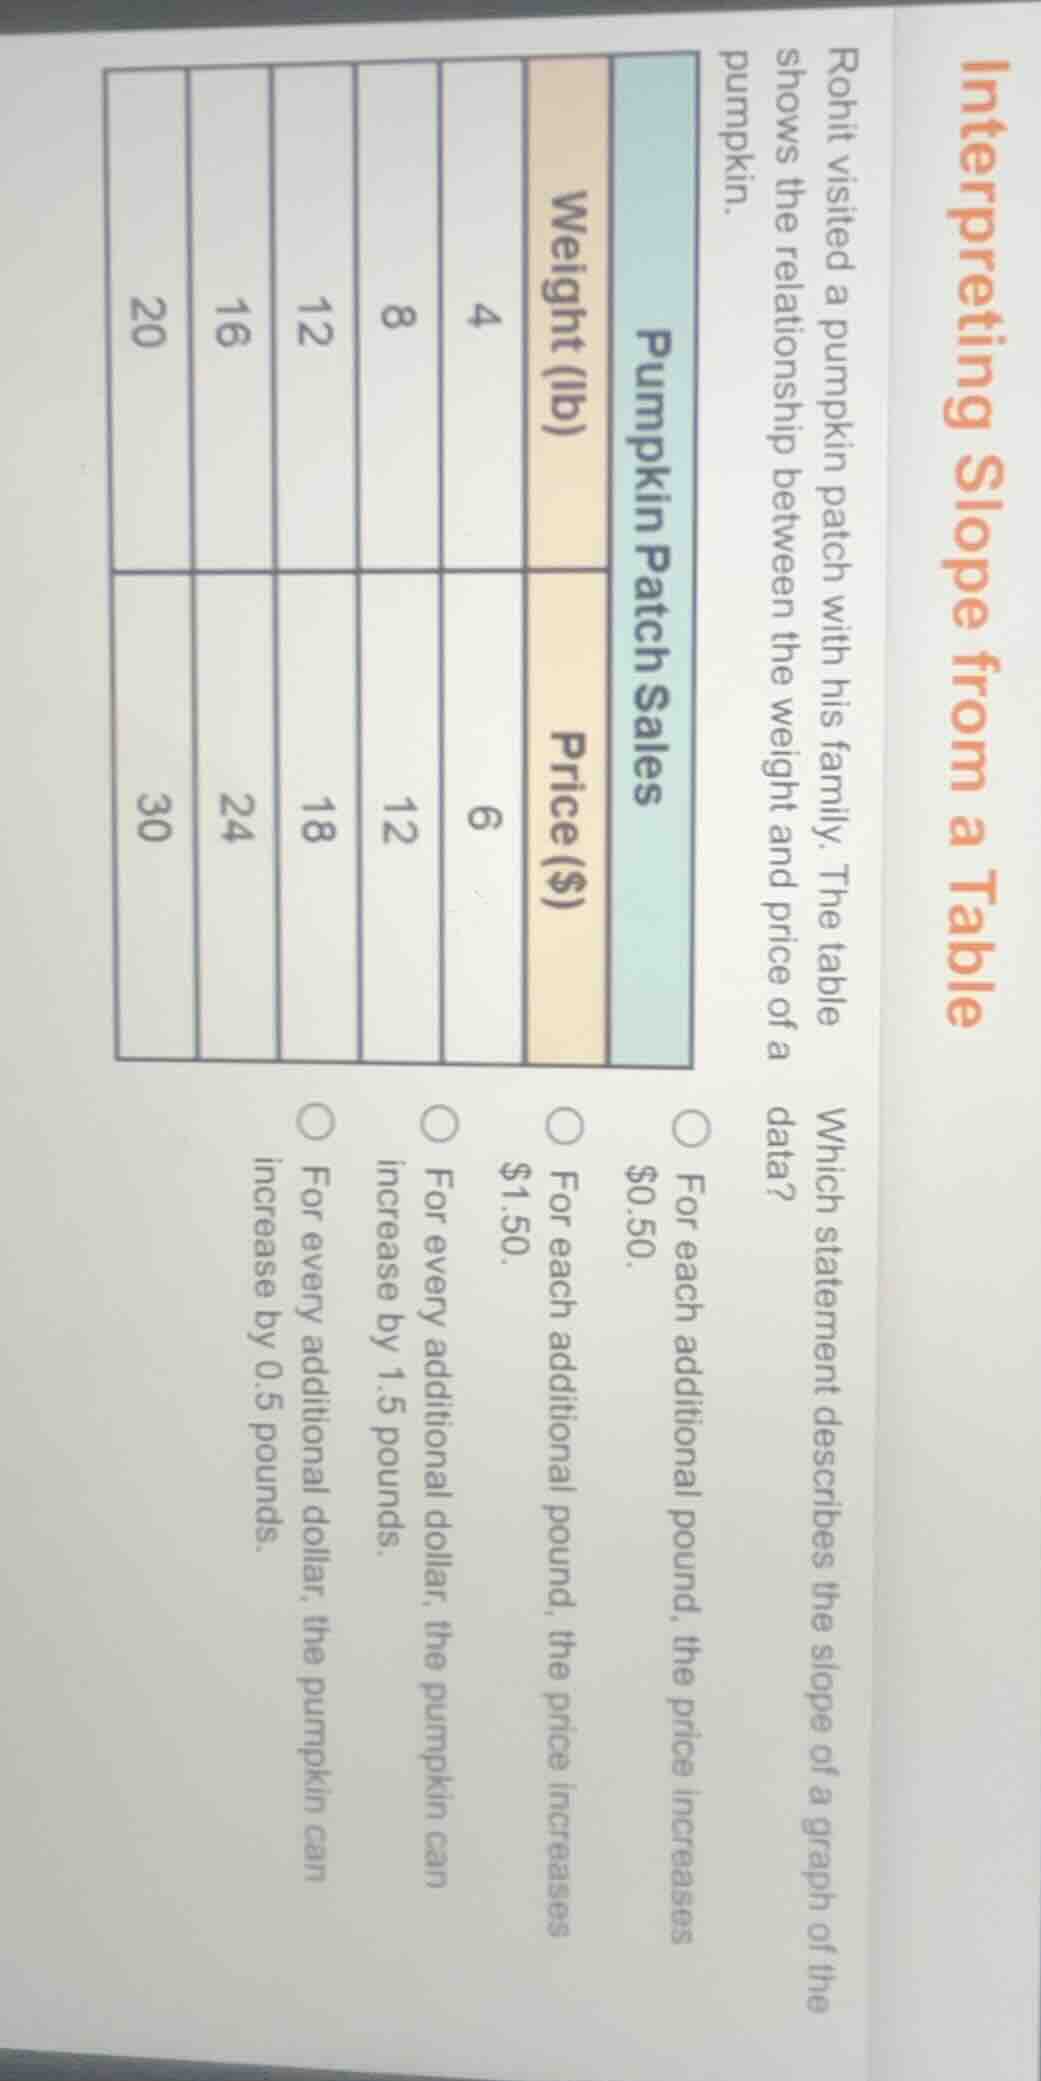
rohit visited a pumpkin patch with his family. the table shows the relationship between the weight and price of a pumpkin.
pumpkin patch sales
weight (lb) 4 8 12 16 20
price ($) 6 12 18 24 30
which statement describes the slope of a graph of the data?
- for each additional pound, the price increases $0.50.
- for each additional pound, the price increases $1.50.
- for every additional dollar, the pumpkin can increase by 1.5 pounds.
- for every additional dollar, the pumpkin can increase by 0.5 pounds.
Step1: Calculate slope (price/weight)
Slope = $\frac{\text{Change in Price}}{\text{Change in Weight}} = \frac{6-0}{4-0} = \frac{6}{4} = 1.5$
Step2: Interpret the slope value
The slope means for each +1 lb, price rises by $1.50.
Step3: Verify other options
Check inverse slope: $\frac{1}{1.5} \approx 0.67$, so other options are incorrect.

Snap & solve any problem in the app
Get step-by-step solutions on Sovi AI
Photo-based solutions with guided steps
Explore more problems and detailed explanations
For each additional pound, the price increases $1.50.