QUESTION IMAGE
Question
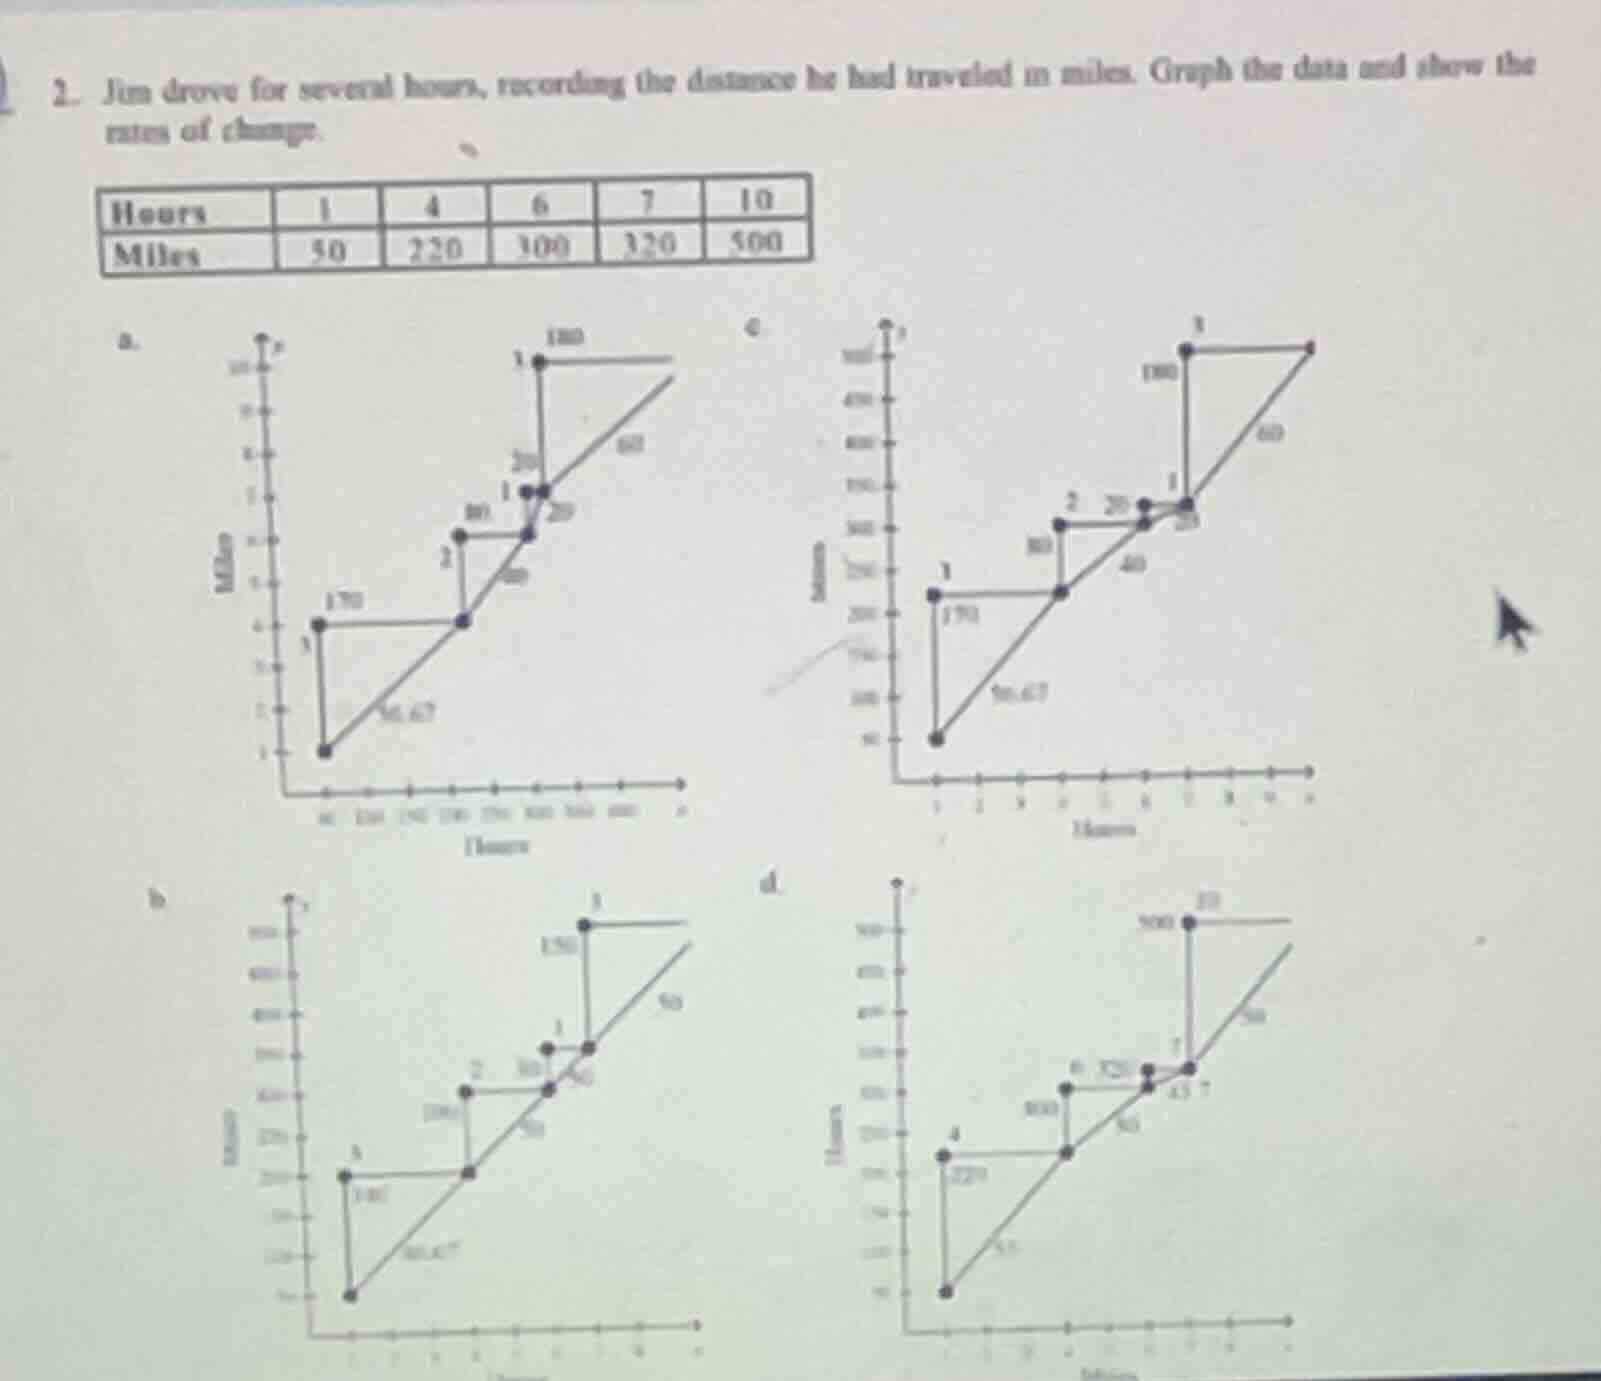
- jim drove for several hours, recording the distance he had traveled in miles. graph the data and show the rates of change.
hours | 1 | 4 | 6 | 7 | 10
miles | 50 | 250 | 300 | 320 | 500
Step1: Calculate rate between 1-4 hours
Rate = $\frac{220-50}{4-1} = \frac{170}{3} \approx 56.67$ miles/hour
Step2: Calculate rate between 4-6 hours
Rate = $\frac{300-220}{6-4} = \frac{80}{2} = 40$ miles/hour
Step3: Calculate rate between 6-7 hours
Rate = $\frac{320-300}{7-6} = \frac{20}{1} = 20$ miles/hour
Step4: Calculate rate between 7-10 hours
Rate = $\frac{500-320}{10-7} = \frac{180}{3} = 60$ miles/hour
Step5: Match rates to graph
The correct graph has segments labeled with 56.67, 40, 20, 60, which is option c.

Snap & solve any problem in the app
Get step-by-step solutions on Sovi AI
Photo-based solutions with guided steps
Explore more problems and detailed explanations
c (the graph with y-axis "Miles", x-axis "Hours", and segment rates 56.67, 40, 20, 60)