QUESTION IMAGE
Question
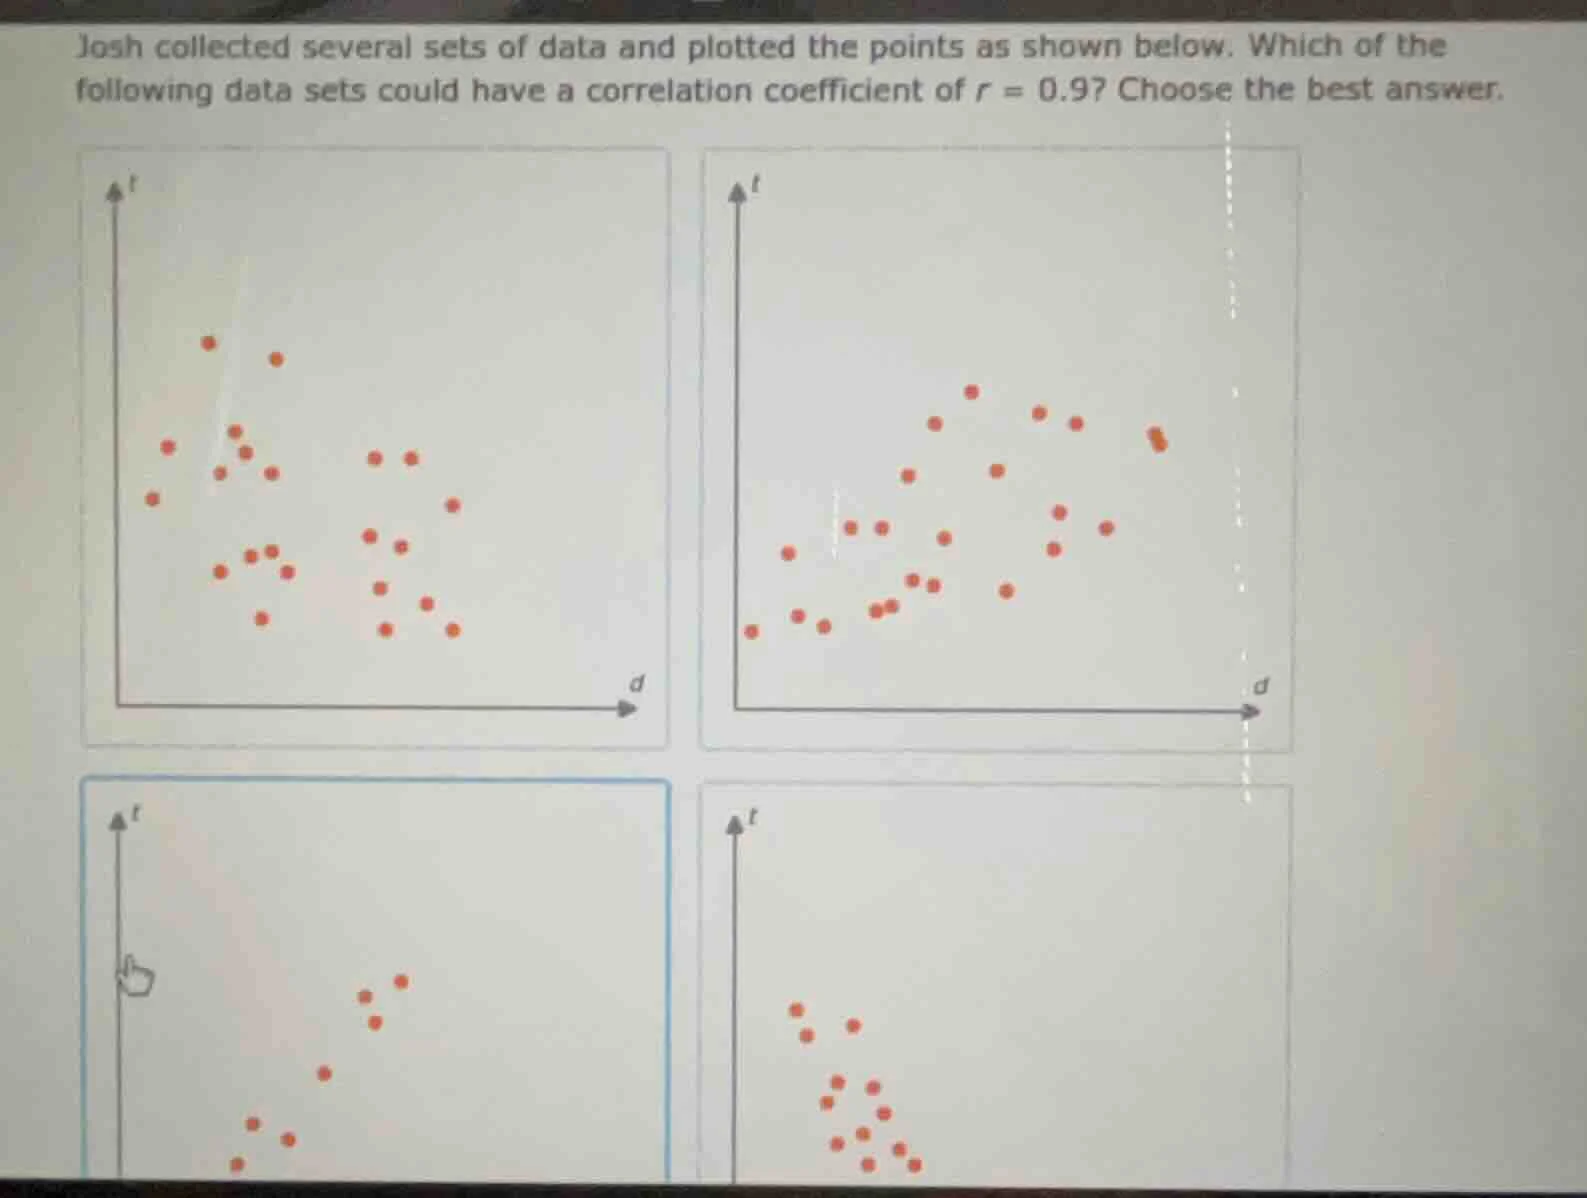
josh collected several sets of data and plotted the points as shown below. which of the following data sets could have a correlation coefficient of r = 0.9? choose the best answer.
Step1: Recall correlation coefficient meaning
A correlation coefficient $r=0.9$ represents a strong positive linear relationship between two variables, meaning data points cluster closely along an upward-sloping line.
Step2: Analyze each scatter plot
- Top-left: Points show no clear upward/downward trend (weak/no correlation).
- Top-right: Points follow a clear upward trend with tight clustering (strong positive correlation).
- Bottom-left: Points show an upward trend but with fewer points; while positive, the tightness matches a strong $r$, but the top-right has more consistent clustering.
- Bottom-right: Points show a downward trend (negative correlation, so $r$ would be negative).
Step3: Match to $r=0.9$
Only the top-right plot has the strong positive linear pattern consistent with $r=0.9$.

Snap & solve any problem in the app
Get step-by-step solutions on Sovi AI
Photo-based solutions with guided steps
Explore more problems and detailed explanations
The top-right scatter plot (the one with points forming a clear, tight upward-sloping pattern)