QUESTION IMAGE
Question
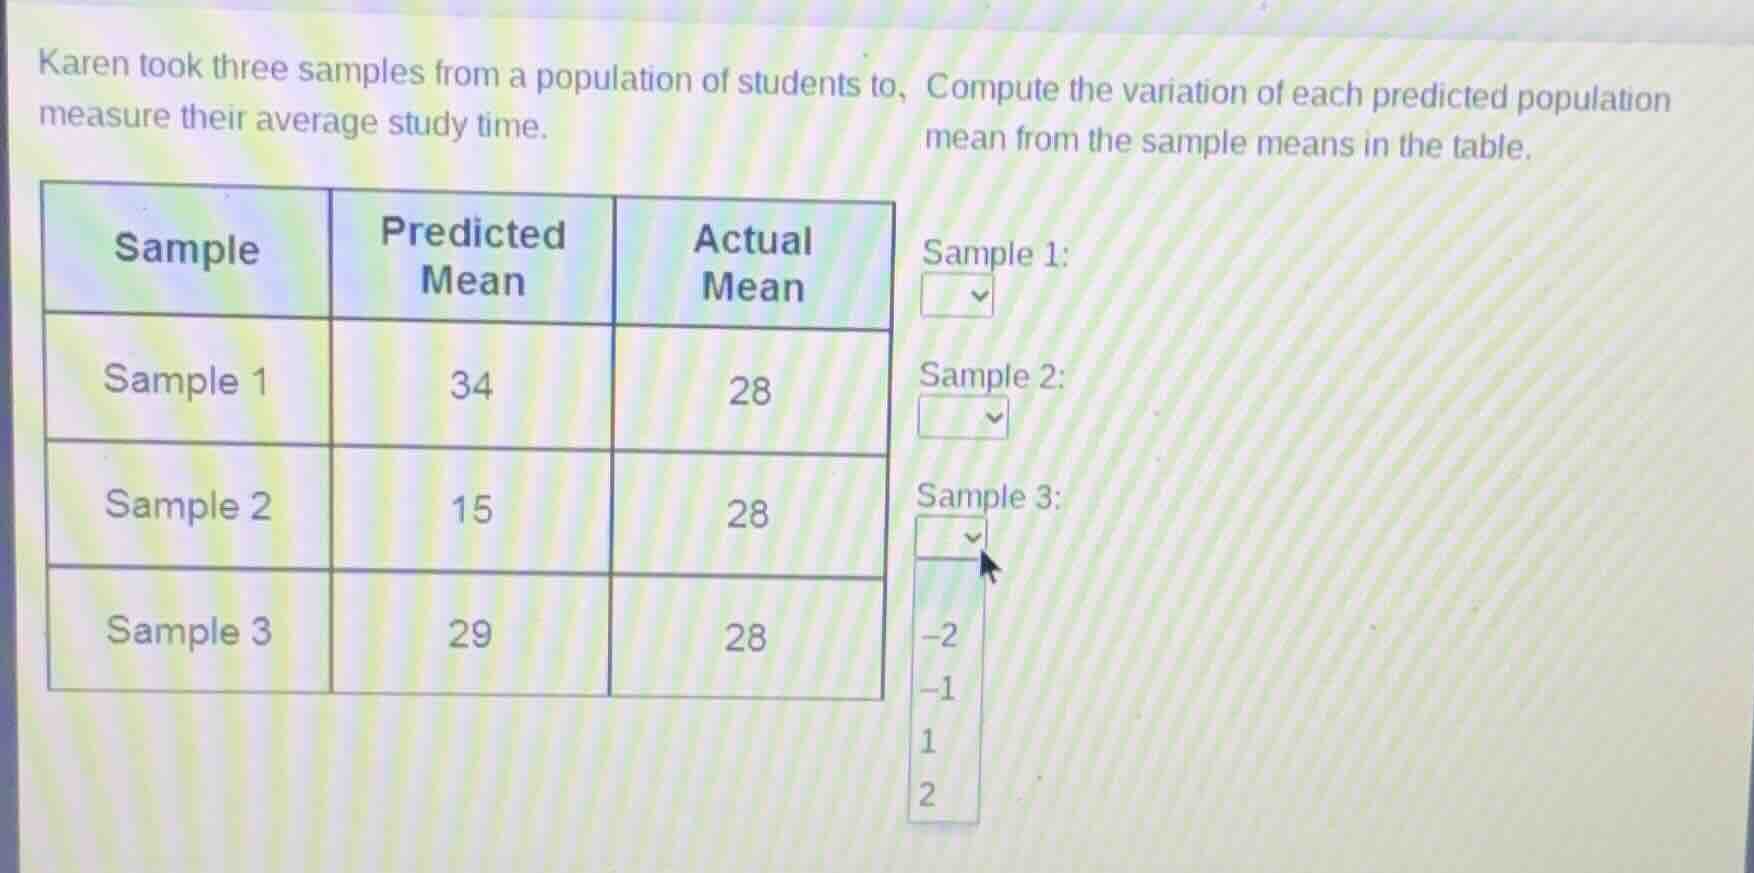
karen took three samples from a population of students to measure their average study time. compute the variation of each predicted population mean from the sample means in the table. \
\
| sample | predicted mean | actual mean | \ |
| --- | --- | --- | \ |
| sample 1 | 34 | 28 | \ |
| sample 2 | 15 | 28 | \ |
| sample 3 | 29 | 28 | \ |
\
sample 1: \
sample 2: \
sample 3: \
-2 \
-1 \
1 \
2
Step1: Calculate Sample 1 variation
Variation = Predicted Mean - Actual Mean
$34 - 28 = 6$
Step2: Calculate Sample 2 variation
Variation = Predicted Mean - Actual Mean
$15 - 28 = -13$
Step3: Calculate Sample 3 variation
Variation = Predicted Mean - Actual Mean
$29 - 28 = 1$

Snap & solve any problem in the app
Get step-by-step solutions on Sovi AI
Photo-based solutions with guided steps
Explore more problems and detailed explanations
Sample 1: 6
Sample 2: -13
Sample 3: 1