QUESTION IMAGE
Question
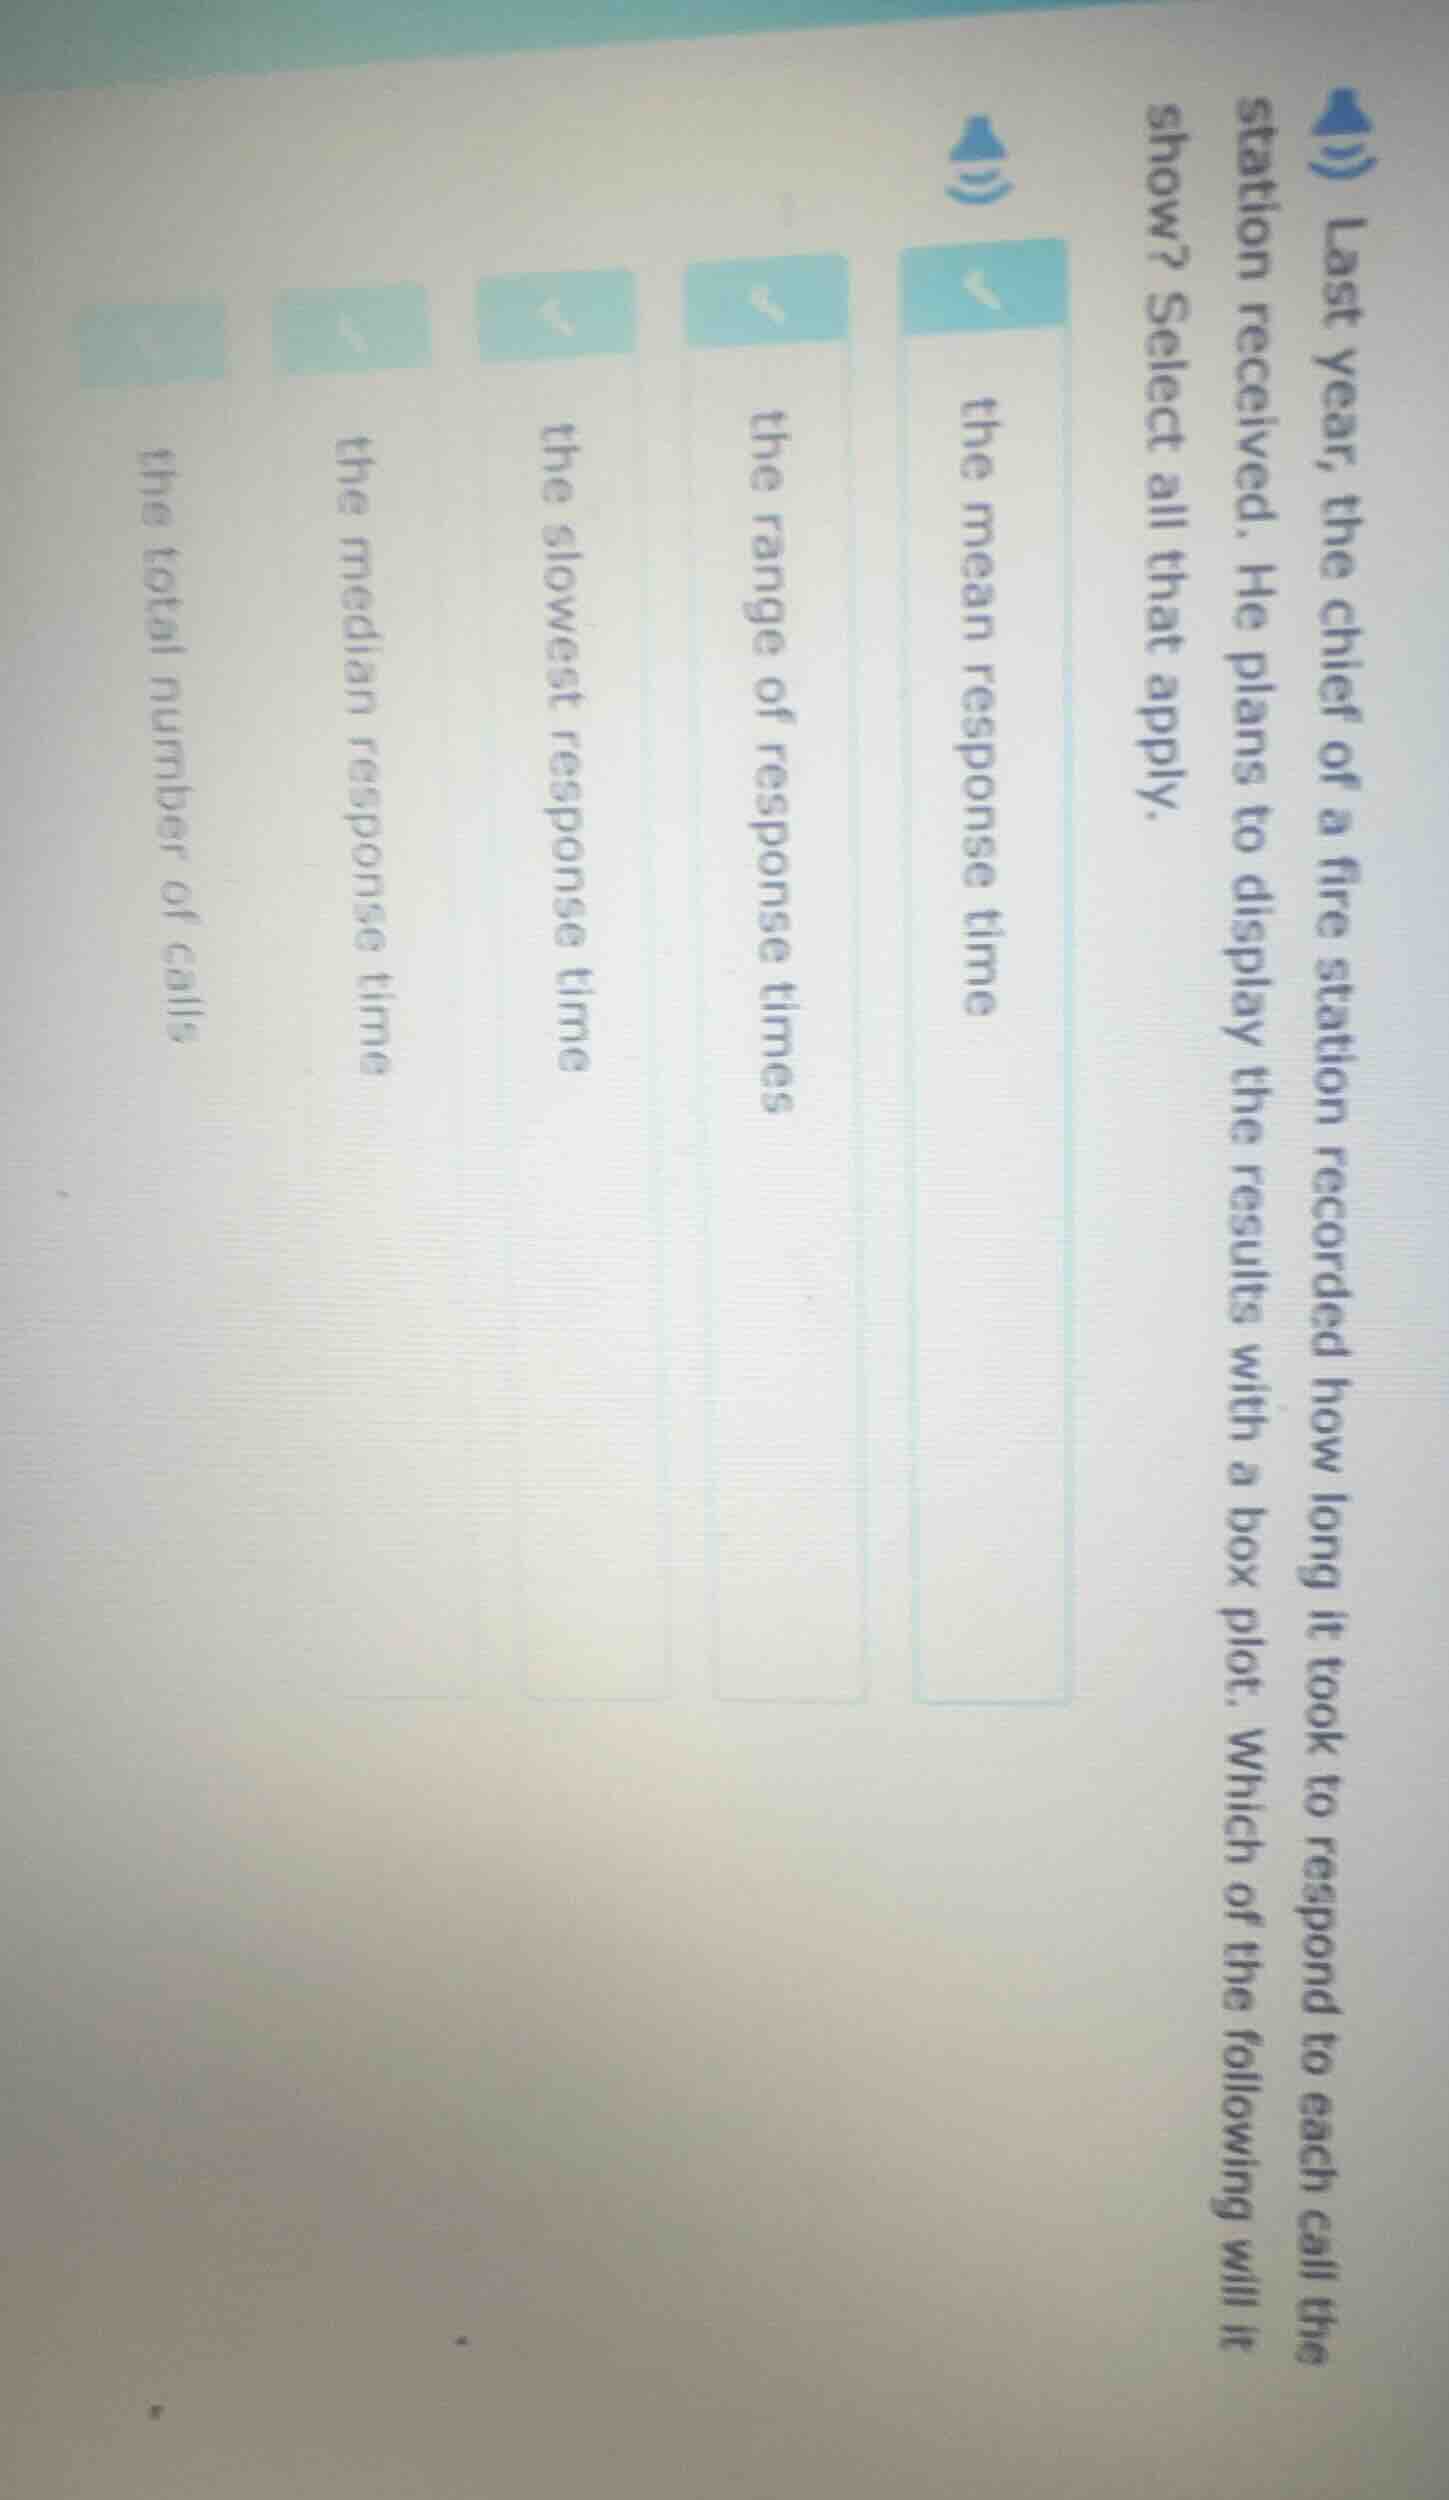
last year, the chief of a fire station recorded how long it took to respond to each call the station received. he plans to display the results with a box plot. which of the following will it show? select all that apply. the mean response time the range of response times the slowest response time the median response time the total number of calls
A box plot (box - and - whisker plot) is used to display the five - number summary of a dataset, which includes the minimum value, the first quartile ($Q_1$), the median ($Q_2$), the third quartile ($Q_3$), and the maximum value.
- The range of response times can be calculated as the difference between the maximum and minimum values, and these two values are part of what a box plot shows (the whiskers extend to the minimum and maximum, or to the non - outlier extremes).
- The median response time is the middle value of the dataset (the line inside the box in a box plot), so it is shown.
- The slowest response time is the maximum value, which is related to the upper whisker (or the end of the upper part of the box - plot if there are no outliers), so it can be inferred from the box plot.
- The mean response time is not directly shown in a box plot, as a box plot is based on medians and quartiles, not the mean.
- The total number of calls is not related to what a box plot displays, as a box plot is about the distribution of a single variable (response time here), not the count of observations.

Snap & solve any problem in the app
Get step-by-step solutions on Sovi AI
Photo-based solutions with guided steps
Explore more problems and detailed explanations
the range of response times, the median response time, the slowest response time