QUESTION IMAGE
Question
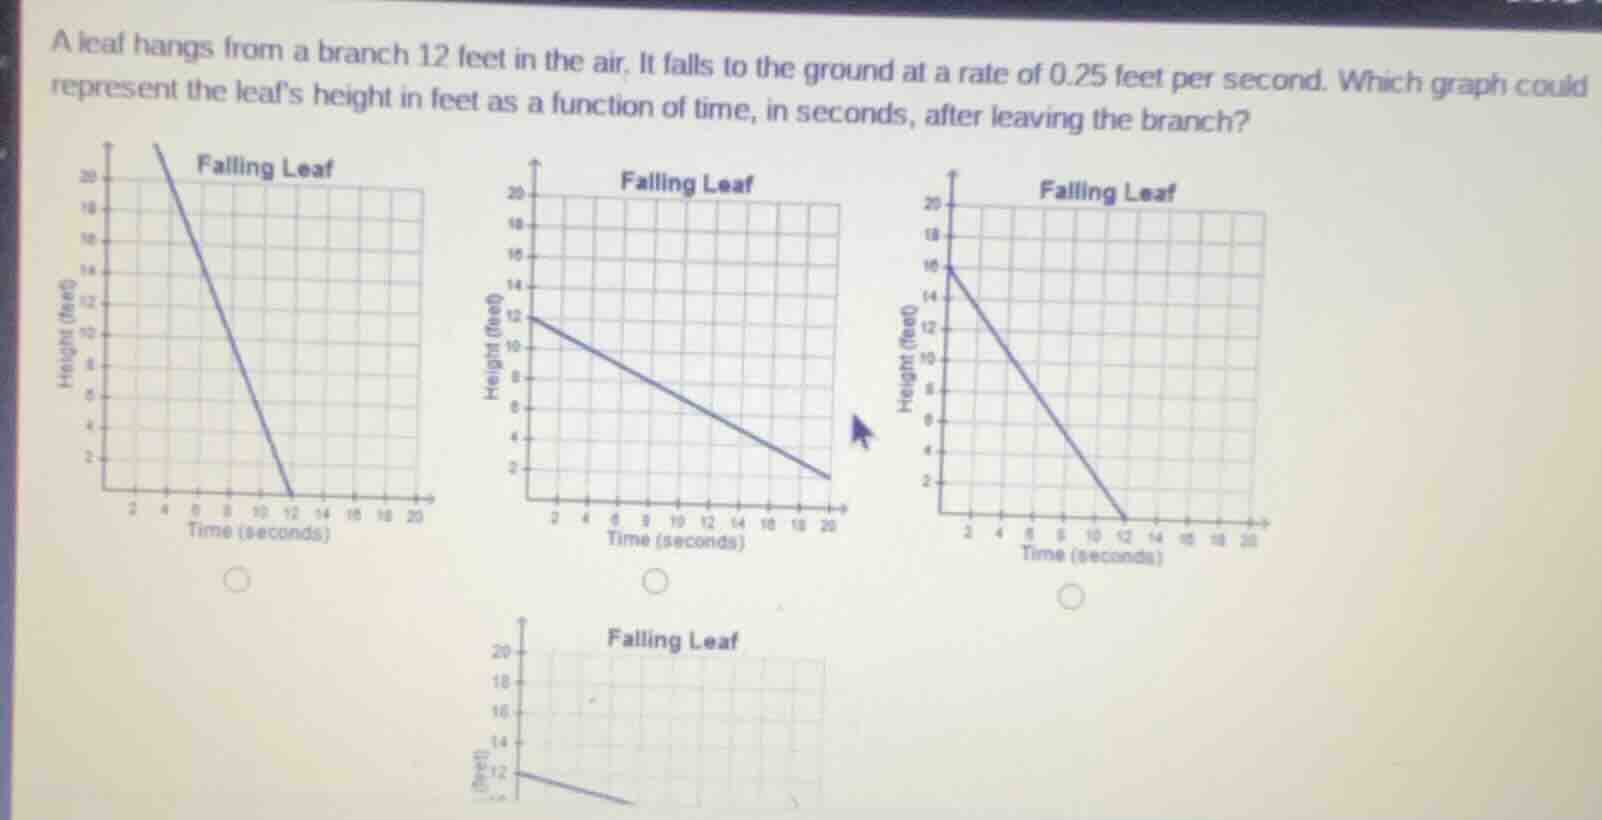
a leaf hangs from a branch 12 feet in the air. it falls to the ground at a rate of 0.25 feet per second. which graph could represent the leafs height in feet as a function of time, in seconds, after leaving the branch? (graphs are shown with titles falling leaf, axes: height (feet) and time (seconds))
Step1: Define height function
Let $h(t)$ = height, $t$ = time. Initial height is 12 ft, rate is -0.25 ft/s.
$h(t) = 12 - 0.25t$
Step2: Find time to reach ground
Set $h(t)=0$, solve for $t$:
$0 = 12 - 0.25t$
$0.25t = 12$
$t = \frac{12}{0.25} = 48$ seconds
Step3: Match to graph
The graph starts at $(0,12)$ and reaches $h=0$ at $t=48$, with a shallow negative slope (due to slow fall rate).

Snap & solve any problem in the app
Get step-by-step solutions on Sovi AI
Photo-based solutions with guided steps
Explore more problems and detailed explanations
The correct graph is the second top-right graph (starts at (0,12), shallow downward slope, reaches height 0 at t=20+ seconds matching the 48-second fall time scale).