QUESTION IMAGE
Question
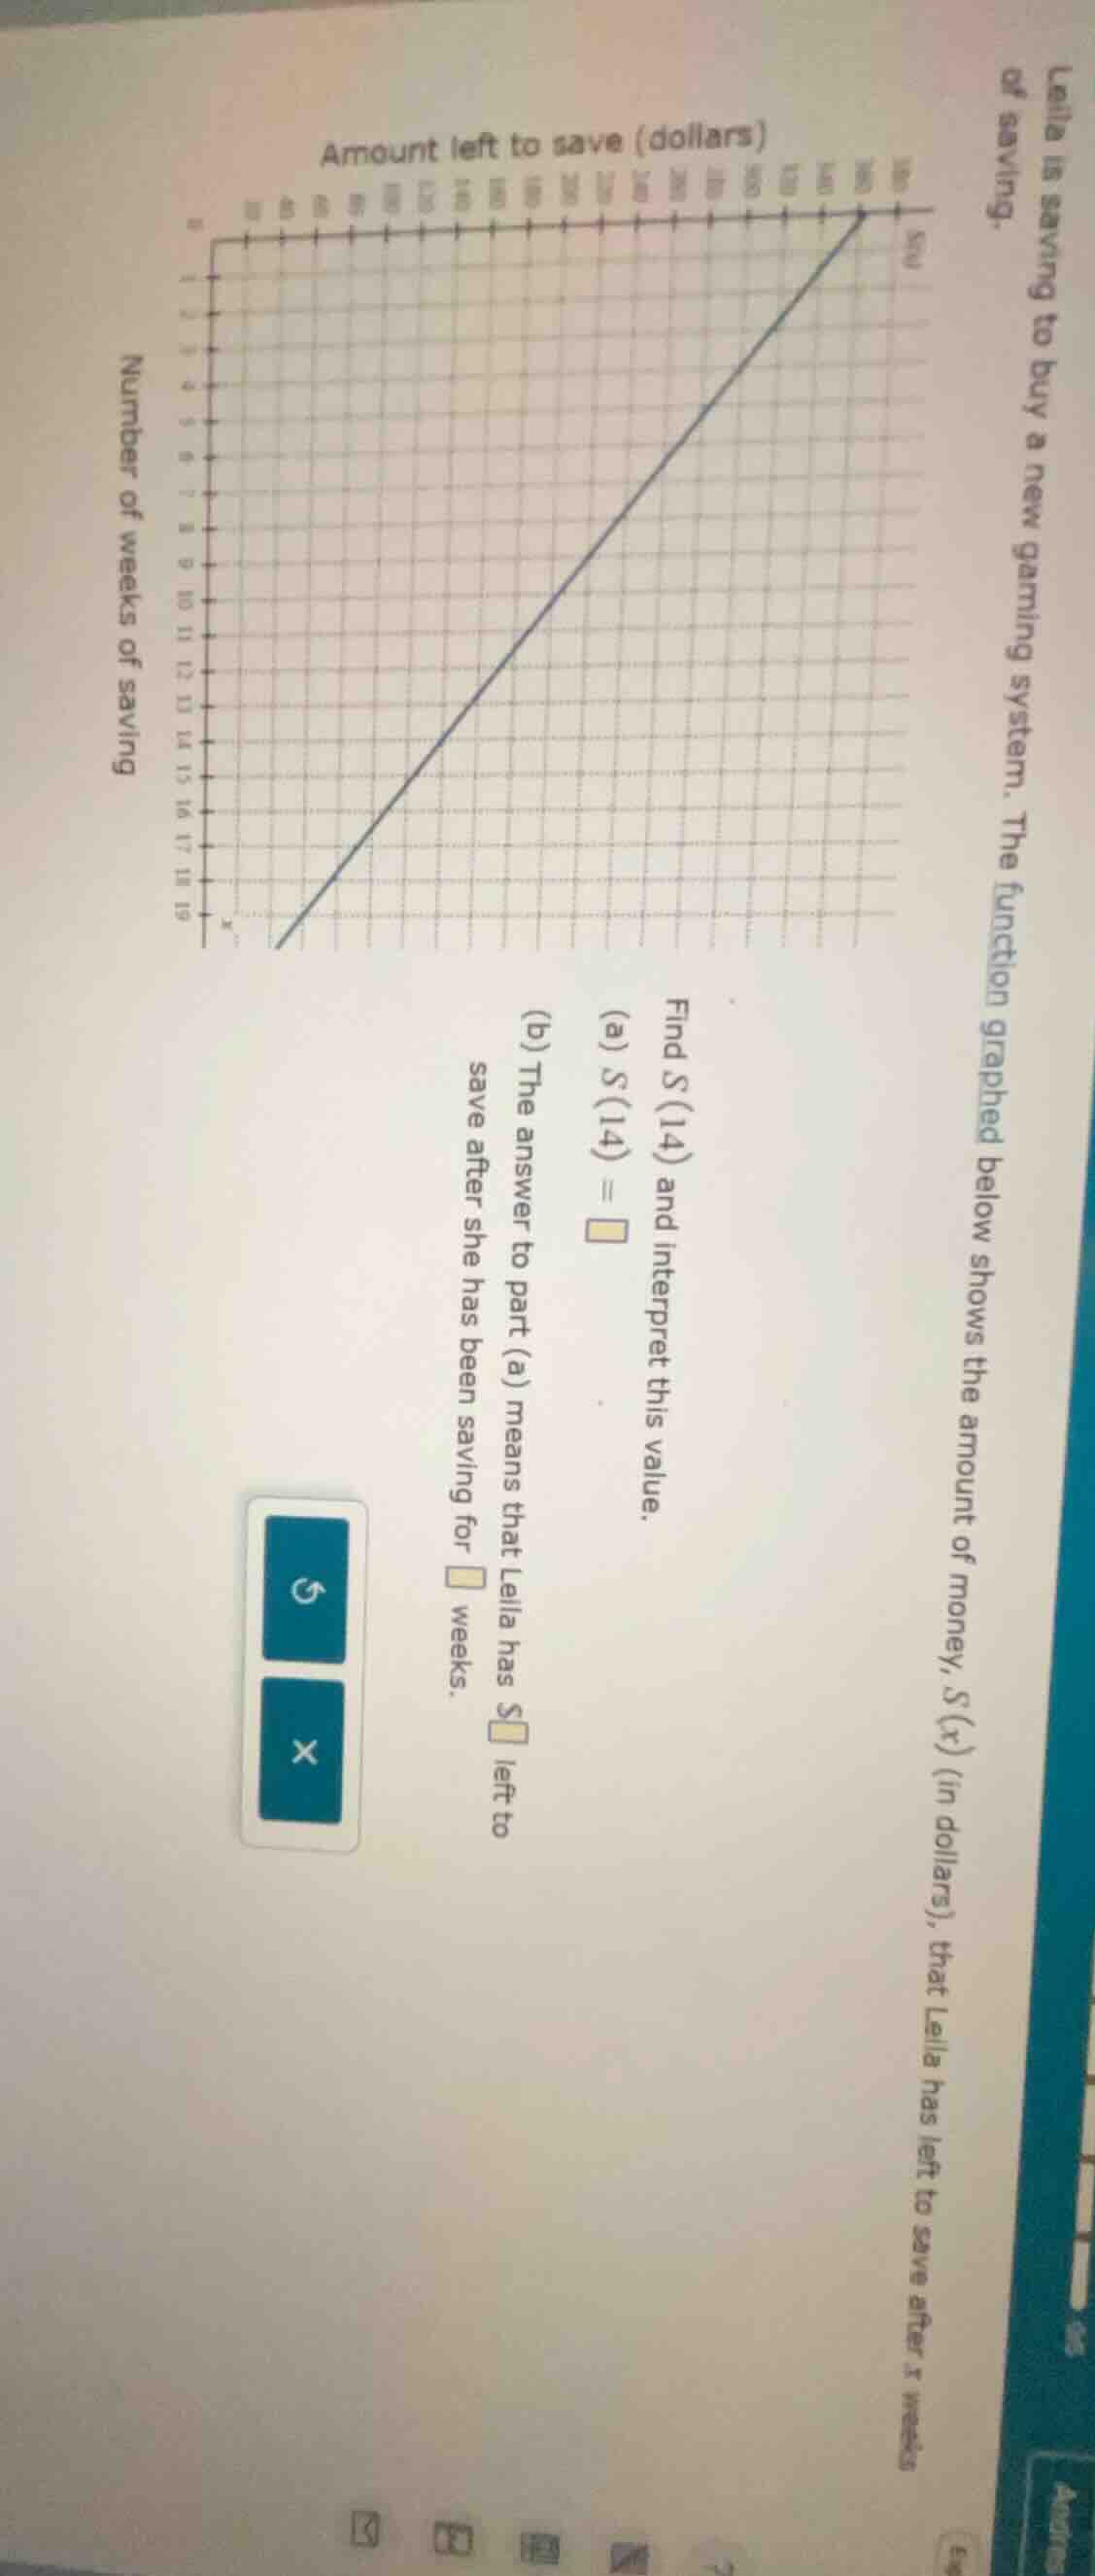
lella is saving to buy a new gaming system. the function graphed below shows the amount of money, s(x) (in dollars), that lella has left to save after x weeks of saving.
find s(14) and interpret this value.
(a) s(14) =
(b) the answer to part (a) means that lella has $ left to save after she has been saving for weeks.
Step1: Analyze the graph
The graph shows the amount left to save \( S(x) \) (in dollars) after \( x \) weeks of saving. We need to find \( S(14) \), which is the amount left to save after 14 weeks. From the graph, we can assume the linear relationship. Let's assume the graph has a slope and intercept, but from the visual, when \( x = 14 \), we can read the value. (Assuming the graph is a straight line, and from the grid, let's say the y - axis (amount left) at \( x = 14 \) is, for example, if we consider the grid lines, let's assume the slope is such that we can calculate or read. Wait, maybe the graph is a linear function, and from the graph, when \( x = 14 \), let's say the value is 60? Wait, no, maybe I need to check the grid. Wait, the x - axis is number of weeks, y - axis is amount left. Let's assume that when \( x = 0 \), \( S(0) = 160 \) (the y - intercept), and when \( x = 16 \), \( S(16)=0 \)? Wait, no, the graph is decreasing? Wait, the problem says "amount left to save", so as weeks increase, amount left decreases? Wait, the original graph: the x - axis is number of weeks (from 0 to 19), y - axis is amount left. Wait, the line is going from the top right to bottom left? Wait, maybe I misread. Wait, the y - axis is "Amount left to save (dollars)" and x - axis is "Number of weeks of saving". So if it's a linear function, let's find two points. Let's say when \( x = 0 \), \( S(0)=160 \), and when \( x = 16 \), \( S(16) = 0 \). Then the slope \( m=\frac{0 - 160}{16-0}=\frac{- 160}{16}=- 10 \). So the equation is \( S(x)=- 10x + 160 \). Then \( S(14)=-10\times14 + 160=-140 + 160 = 20 \). Wait, maybe the graph is like that. Let's verify. If \( x = 14 \), \( S(14)=20 \). So the amount left after 14 weeks is 20 dollars.
Step2: Interpret \( S(14) \)
\( S(14) \) means the amount of money (in dollars) that Leila has left to save after 14 weeks of saving.

Snap & solve any problem in the app
Get step-by-step solutions on Sovi AI
Photo-based solutions with guided steps
Explore more problems and detailed explanations
(a) \( S(14)=\boxed{20} \) (assuming the linear model \( S(x)=- 10x + 160 \), so \( S(14)=-10\times14 + 160 = 20 \))
(b) The answer to part (a) means that Leila has \( \$20 \) left to save after she has been saving for 14 weeks.