QUESTION IMAGE
Question
lesson practice
a1.4.04
name: date period
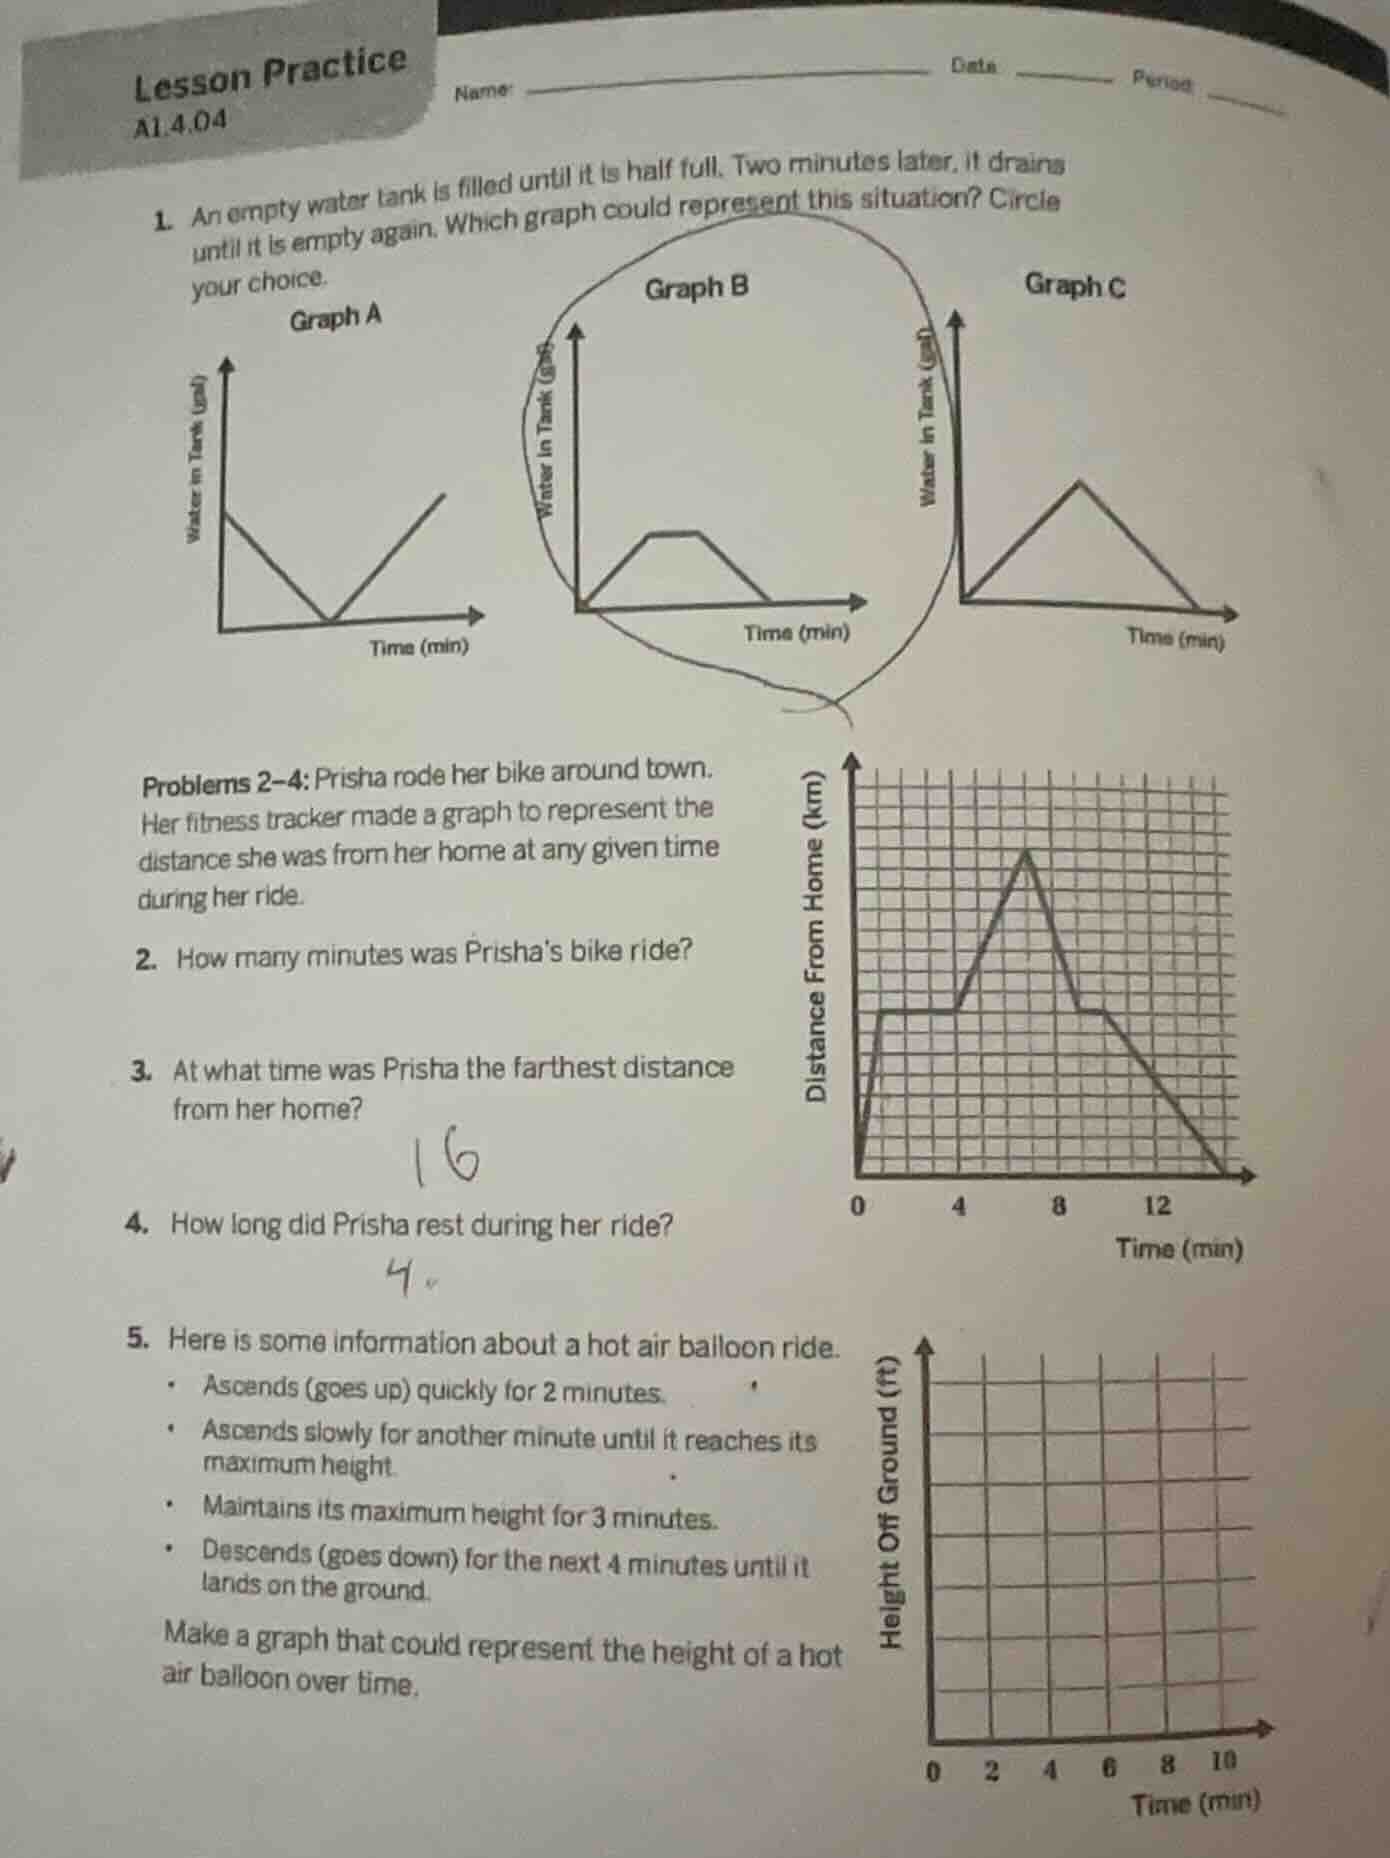
- an empty water tank is filled until it is half full. two minutes later, it drains until it is empty again. which graph could represent this situation? circle your choice.
graph a graph b graph c
- how many minutes was prishas bike ride?
- at what time was prisha the farthest distance from her home?
- how long did prisha rest during her ride?
- here is some information about a hot air balloon ride.
- ascends (goes up) quickly for 2 minutes.
- ascends slowly for another minute until it reaches its maximum height.
- maintains its maximum height for 3 minutes.
- descends (goes down) for the next 4 minutes until it lands on the ground.
make a graph that could represent the height of a hot air balloon over time.
Question 1
Step1: Analyze the tank filling/draining process
The tank starts empty, is filled to half (so the water level increases to half), then waits for 2 minutes (water level stays constant), then drains to empty (water level decreases to 0).
Step2: Evaluate each graph
- Graph A: Starts with water, drains then fills. Doesn't match (tank was empty initially).
- Graph B: Starts at 0, increases (filling), stays constant (2 minutes wait), then decreases (draining) to 0. Matches.
- Graph C: Increases then decreases, no constant phase. Doesn't match the 2 - minute wait.
Step1: Identify the end of the ride
The graph of distance from home vs. time ends when the distance returns to 0 (since she ends at home).
Step2: Find the time at distance 0
Looking at the graph, the time when distance from home is 0 at the end is 14 minutes? Wait, no, let's check the x - axis. Wait, the graph's x - axis (time) when the distance from home is 0 at the end: let's assume the grid. Wait, the last point where distance is 0: looking at the graph, the time when she gets back home (distance = 0) is at 14 minutes? Wait, no, maybe I misread. Wait, the graph: let's see, the x - axis has time in minutes. The ride ends when she is back home (distance from home = 0). Looking at the graph, the time when distance is 0 at the end is 14 minutes? Wait, no, maybe the correct time is 14? Wait, no, let's check again. Wait, the graph: the x - axis, each grid is, say, 1 minute. The last point where distance from home is 0 is at 14 minutes? Wait, maybe I made a mistake. Wait, the problem: Prisha's bike ride. The graph: when does the distance from home become 0 at the end? Let's see, the graph's x - axis: from 0 to, say, 14? Wait, maybe the correct answer is 14 minutes? Wait, no, let's re - examine. Wait, the graph: the time when she is back home (distance = 0) is at 14 minutes. So the bike ride was 14 minutes? Wait, maybe I misread. Wait, the original graph: let's assume that the time when the distance from home is 0 at the end is 14 minutes.
Step1: Find the maximum distance
The farthest distance from home is the highest point on the distance - time graph.
Step2: Find the time at maximum distance
Looking at the graph, the time when the distance from home is maximum (the peak of the graph) is at 8 minutes? Wait, the graph: the peak (highest distance) occurs at 8 minutes? Let's check the x - axis. If the peak is at x = 8 (time in minutes), then that's when she is farthest.

Snap & solve any problem in the app
Get step-by-step solutions on Sovi AI
Photo-based solutions with guided steps
Explore more problems and detailed explanations
Graph B