QUESTION IMAGE
Question
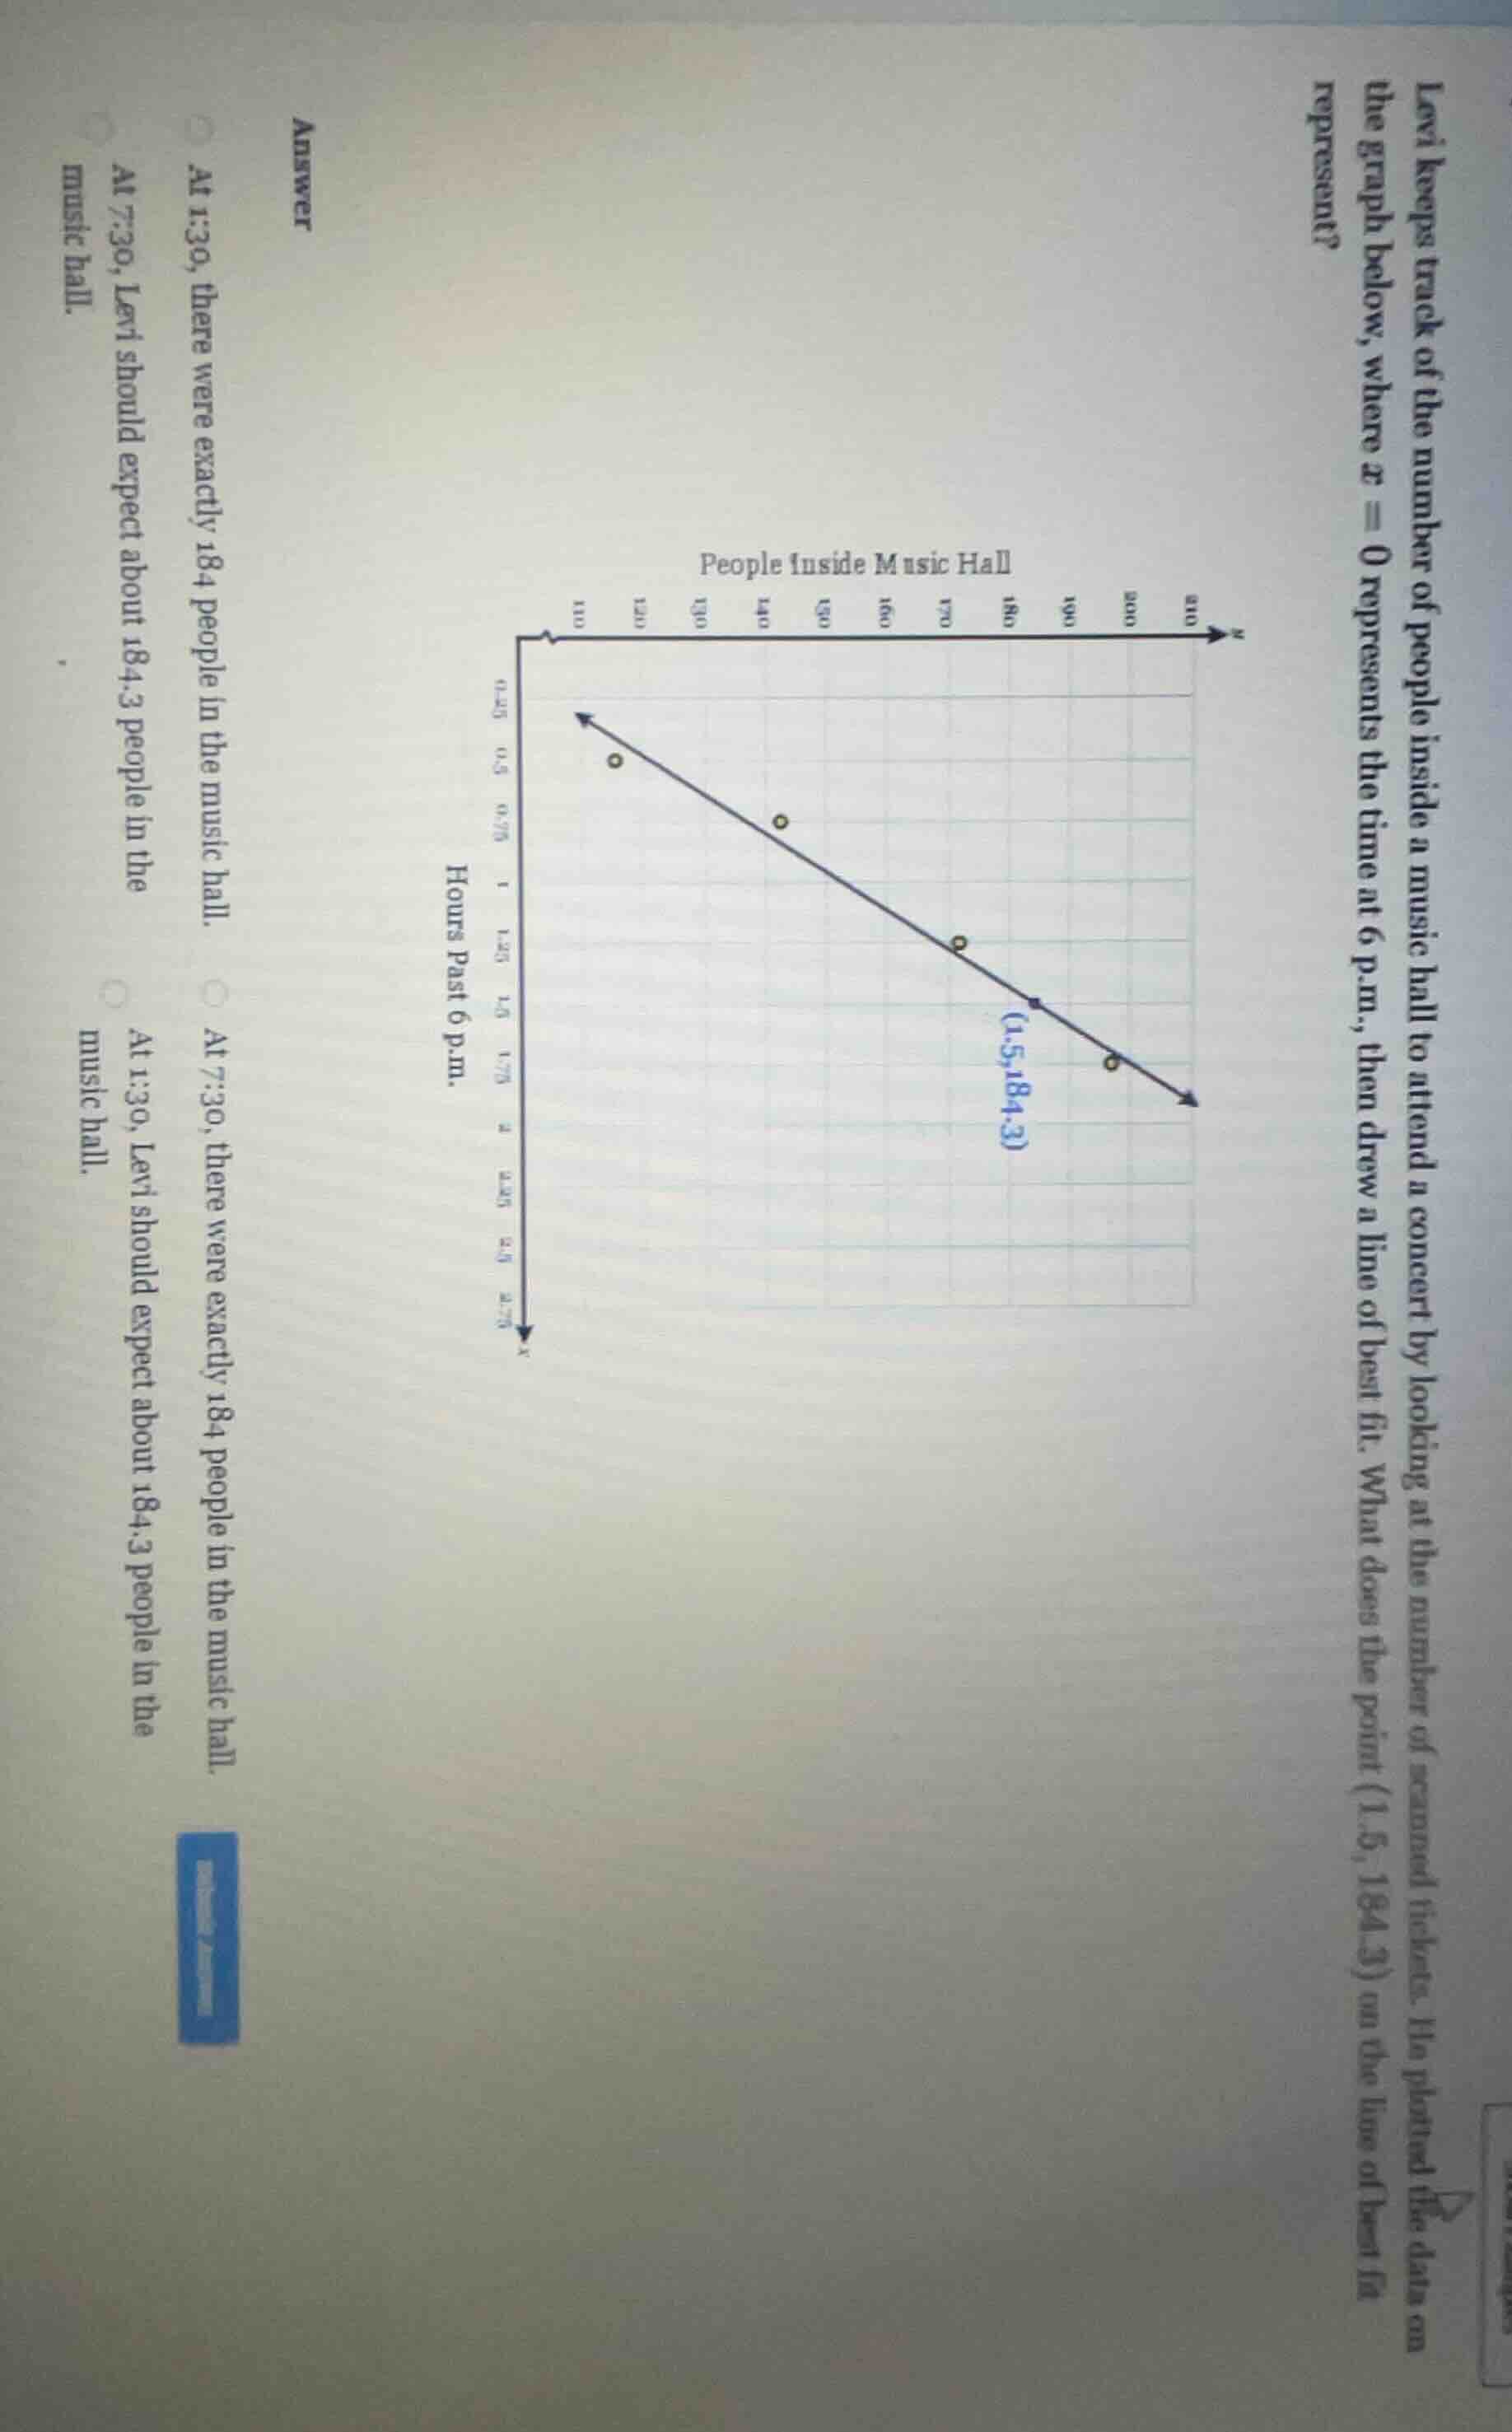
levi keeps track of the number of people inside a music hall to attend a concert by looking at the number of scanned tickets. he plotted the data on the graph below, where ( x = 0 ) represents the time at 6 p.m., then drew a line of best fit. what does the point ( (1.5, 184.3) ) on the line of best fit represent?
answer
- at 1:30, there were exactly 184 people in the music hall.
- at 7:30, levi should expect about ( 184.3 ) people in the music hall.
- at 7:30, there were exactly 184 people in the music hall.
- at 1:30, levi should expect about ( 184.3 ) people in the music hall.
(graph: people inside music hall with x-axis labeled hours past 6 p.m. and y-axis labeled people inside music hall, showing a line of best fit with the point ( (1.5, 184.3) ))
The x-axis represents hours past 6 p.m., so $x=1.5$ means 1.5 hours after 6 p.m., which is 7:30 p.m. The line of best fit is a predictive model, not a record of exact counts, so the y-value 184.3 is the expected number of people at that time.

Snap & solve any problem in the app
Get step-by-step solutions on Sovi AI
Photo-based solutions with guided steps
Explore more problems and detailed explanations
At 7:30, Levi should expect about 184.3 people in the music hall.