QUESTION IMAGE
Question
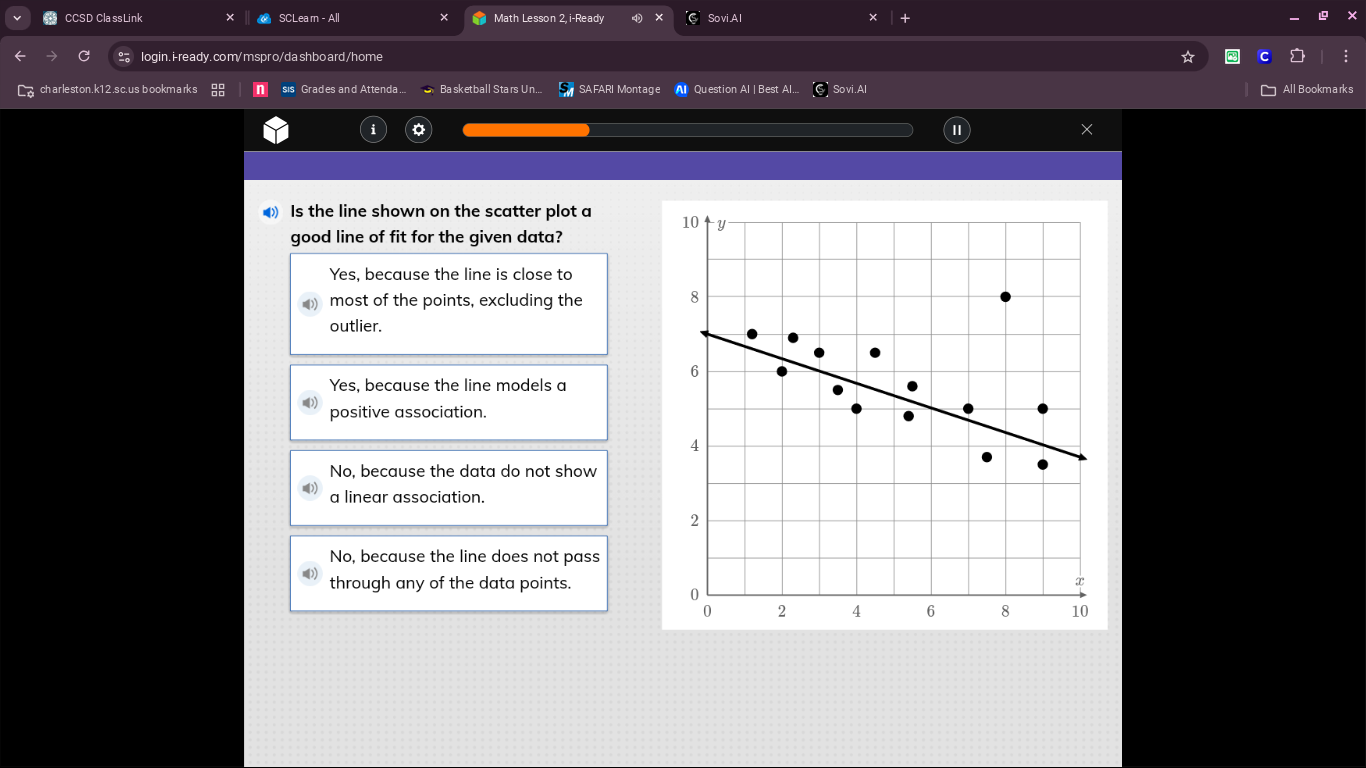
is the line shown on the scatter plot a good line of fit for the given data?
yes, because the line is close to most of the points, excluding the outlier.
yes, because the line models a positive association.
no, because the data do not show a linear association.
no, because the line does not pass through any of the data points.
To determine a good line of fit, we check if the line is close to most data points (excluding outliers if present). The scatter plot has a line that is close to most points, with one outlier (the point at (8,8)). Let's analyze each option:
- Option 1: "Yes, because the line is close to most of the points, excluding the outlier." This matches the definition of a good line of fit (close to most points, outliers are expected to be excluded).
- Option 2: The line shows a negative association (as x increases, y decreases), not positive, so this is incorrect.
- Option 3: The data does show a linear (negative) association, so this is incorrect.
- Option 4: A line of fit doesn't need to pass through data points, it just needs to be close to most, so this is incorrect.

Snap & solve any problem in the app
Get step-by-step solutions on Sovi AI
Photo-based solutions with guided steps
Explore more problems and detailed explanations
A. Yes, because the line is close to most of the points, excluding the outlier.