QUESTION IMAGE
Question
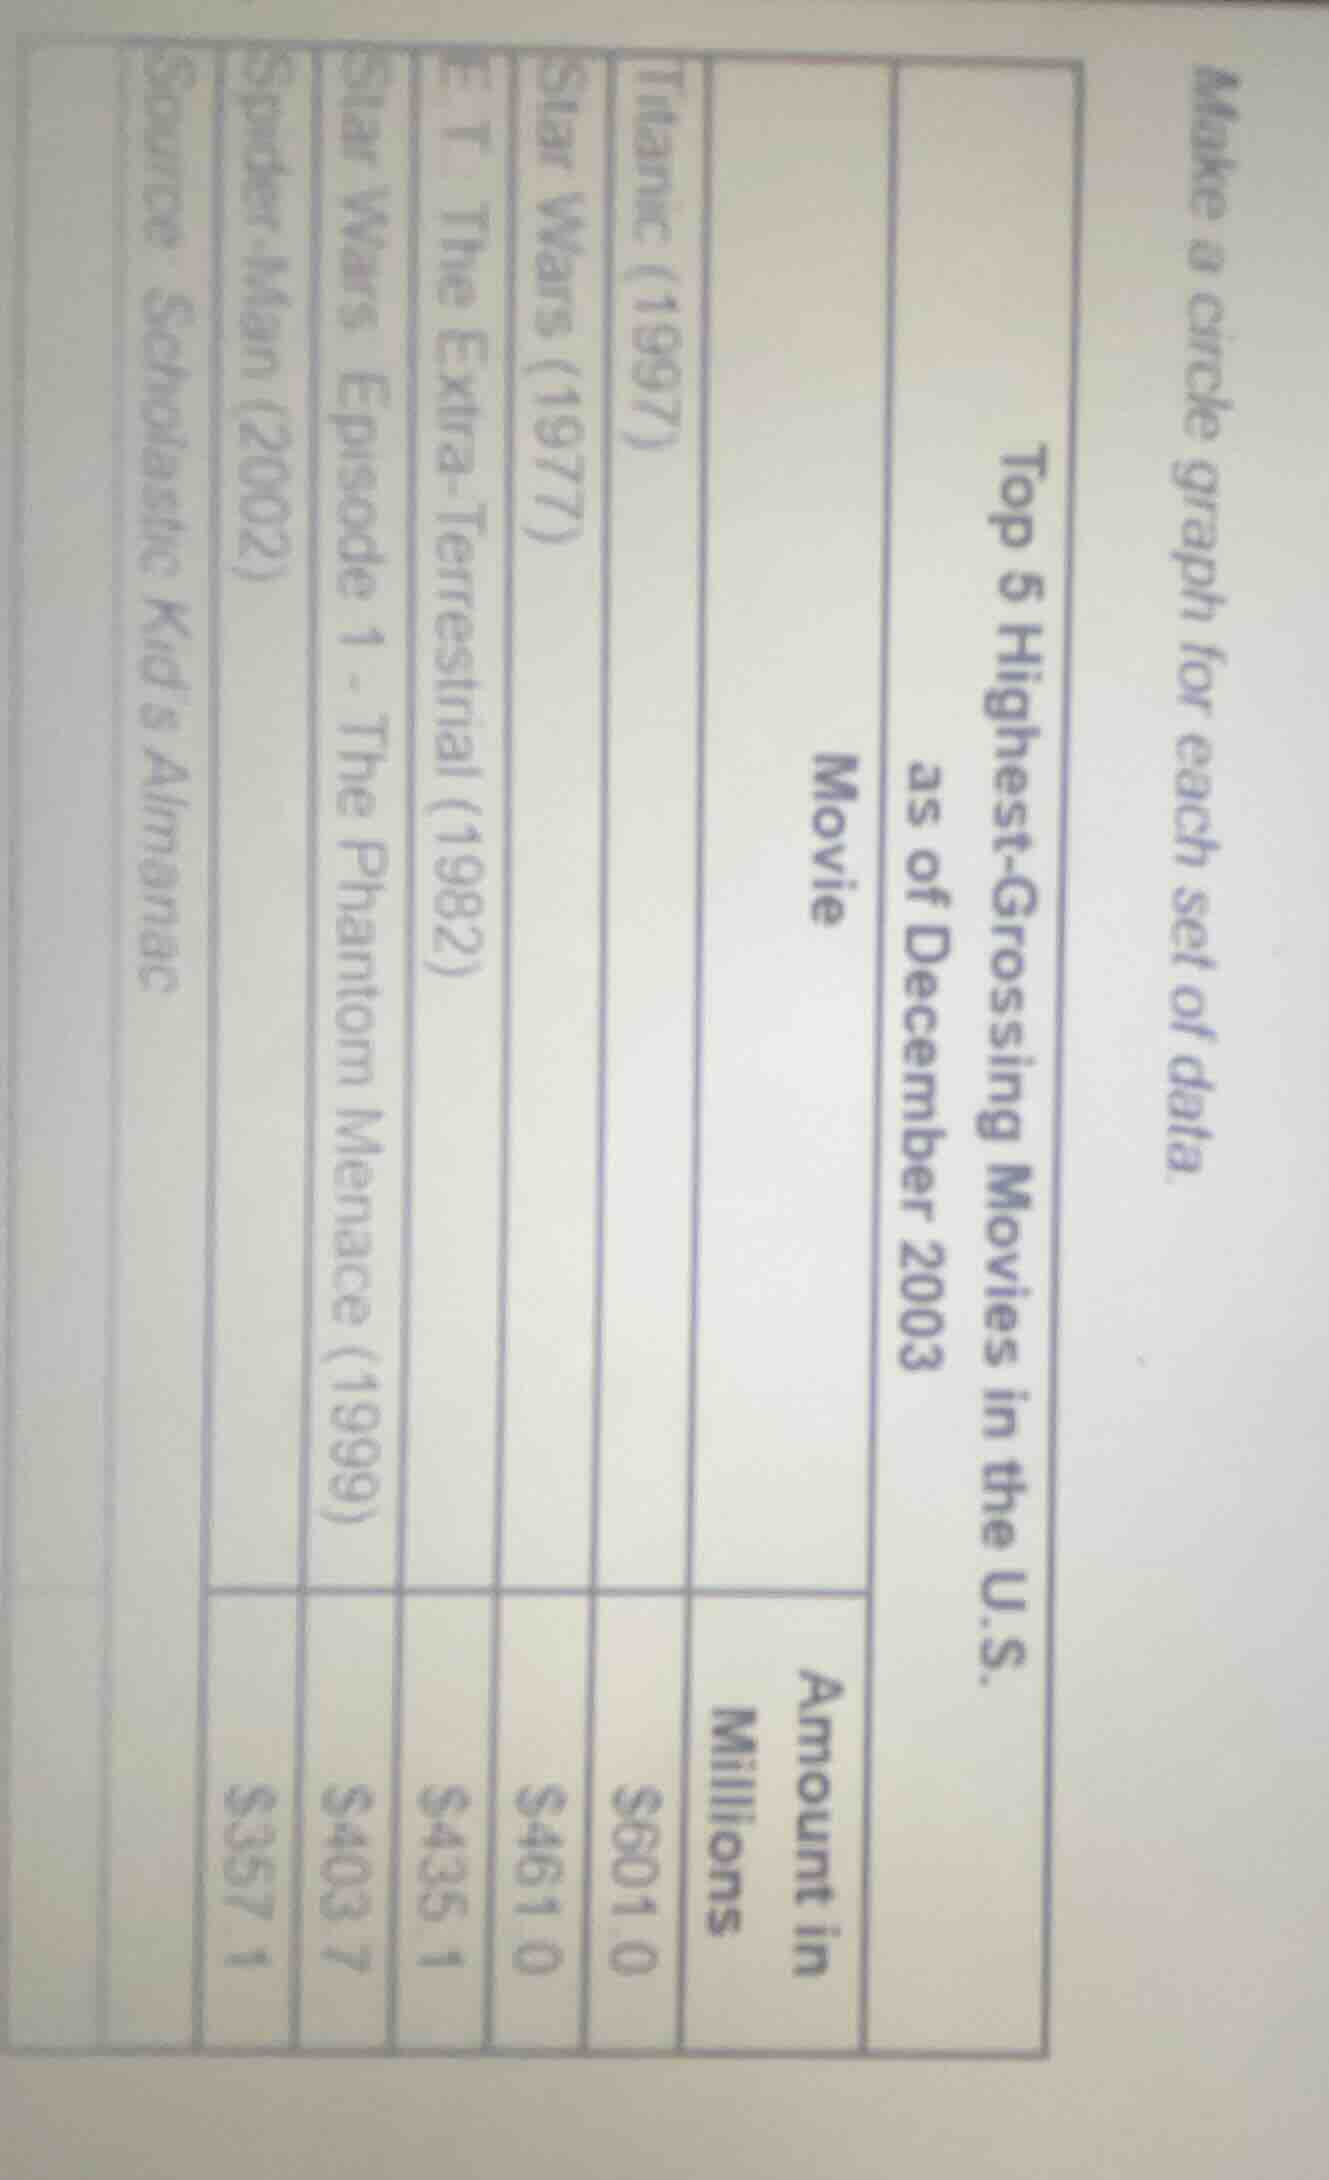
make a circle graph for each set of data.
top 5 highest - grossing movies in the u.s. as of december 2003
| movie | amount in millions |
|---|---|
| star wars (1977) | $4610 |
| e.t. the extra - terrestrial (1982) | $4351 |
| star wars episode 1 - the phantom menace (1999) | $4037 |
| spider - man (2002) | $3571 |
source: scholastic kids almanac
To create a circle graph (pie chart) for the given data, we follow these steps:
Step 1: Calculate the total gross amount
First, we sum up all the amounts:
\[
6010 + 4610 + 4351 + 4037 + 3571
\]
\[
6010 + 4610 = 10620
\]
\[
10620 + 4351 = 14971
\]
\[
14971 + 4037 = 19008
\]
\[
19008 + 3571 = 22579
\]
So the total gross amount is \( \$22579 \) million.
Step 2: Calculate the percentage for each movie
- Titanic (1997): \( \frac{6010}{22579} \times 100 \approx 26.62\% \)
- Star Wars (1977): \( \frac{4610}{22579} \times 100 \approx 20.42\% \)
- E.T. The Extra - Terrestrial (1982): \( \frac{4351}{22579} \times 100 \approx 19.27\% \)
- Star Wars Episode 1 - The Phantom Menace (1999): \( \frac{4037}{22579} \times 100 \approx 17.88\% \)
- Spider - Man (2002): \( \frac{3571}{22579} \times 100 \approx 15.82\% \)
Step 3: Calculate the central angle for each movie (since a full circle is \( 360^\circ \))
- Titanic (1997): \( 0.2662\times360\approx95.83^\circ \)
- Star Wars (1977): \( 0.2042\times360\approx73.51^\circ \)
- E.T. The Extra - Terrestrial (1982): \( 0.1927\times360\approx69.37^\circ \)
- Star Wars Episode 1 - The Phantom Menace (1999): \( 0.1788\times360\approx64.37^\circ \)
- Spider - Man (2002): \( 0.1582\times360\approx56.95^\circ \)
Step 4: Draw the pie chart
- Draw a circle.
- Use a protractor to mark the central angles calculated for each movie.
- Label each sector with the movie name and its corresponding percentage (or amount).
To present the data in a table for clarity:
| Movie | Amount (in Millions) | Percentage (%) | Central Angle (\(^\circ\)) |
|---|---|---|---|
| Star Wars (1977) | 4610 | 20.42 | 73.51 |
| E.T. The Extra - Terrestrial (1982) | 4351 | 19.27 | 69.37 |
| Star Wars Episode 1 - The Phantom Menace (1999) | 4037 | 17.88 | 64.37 |
| Spider - Man (2002) | 3571 | 15.82 | 56.95 |
When drawing the pie chart, you can use different colors or patterns for each sector to distinguish between the movies.

Snap & solve any problem in the app
Get step-by-step solutions on Sovi AI
Photo-based solutions with guided steps
Explore more problems and detailed explanations
To create a circle graph (pie chart) for the given data, we follow these steps:
Step 1: Calculate the total gross amount
First, we sum up all the amounts:
\[
6010 + 4610 + 4351 + 4037 + 3571
\]
\[
6010 + 4610 = 10620
\]
\[
10620 + 4351 = 14971
\]
\[
14971 + 4037 = 19008
\]
\[
19008 + 3571 = 22579
\]
So the total gross amount is \( \$22579 \) million.
Step 2: Calculate the percentage for each movie
- Titanic (1997): \( \frac{6010}{22579} \times 100 \approx 26.62\% \)
- Star Wars (1977): \( \frac{4610}{22579} \times 100 \approx 20.42\% \)
- E.T. The Extra - Terrestrial (1982): \( \frac{4351}{22579} \times 100 \approx 19.27\% \)
- Star Wars Episode 1 - The Phantom Menace (1999): \( \frac{4037}{22579} \times 100 \approx 17.88\% \)
- Spider - Man (2002): \( \frac{3571}{22579} \times 100 \approx 15.82\% \)
Step 3: Calculate the central angle for each movie (since a full circle is \( 360^\circ \))
- Titanic (1997): \( 0.2662\times360\approx95.83^\circ \)
- Star Wars (1977): \( 0.2042\times360\approx73.51^\circ \)
- E.T. The Extra - Terrestrial (1982): \( 0.1927\times360\approx69.37^\circ \)
- Star Wars Episode 1 - The Phantom Menace (1999): \( 0.1788\times360\approx64.37^\circ \)
- Spider - Man (2002): \( 0.1582\times360\approx56.95^\circ \)
Step 4: Draw the pie chart
- Draw a circle.
- Use a protractor to mark the central angles calculated for each movie.
- Label each sector with the movie name and its corresponding percentage (or amount).
To present the data in a table for clarity:
| Movie | Amount (in Millions) | Percentage (%) | Central Angle (\(^\circ\)) |
|---|---|---|---|
| Star Wars (1977) | 4610 | 20.42 | 73.51 |
| E.T. The Extra - Terrestrial (1982) | 4351 | 19.27 | 69.37 |
| Star Wars Episode 1 - The Phantom Menace (1999) | 4037 | 17.88 | 64.37 |
| Spider - Man (2002) | 3571 | 15.82 | 56.95 |
When drawing the pie chart, you can use different colors or patterns for each sector to distinguish between the movies.