QUESTION IMAGE
Question
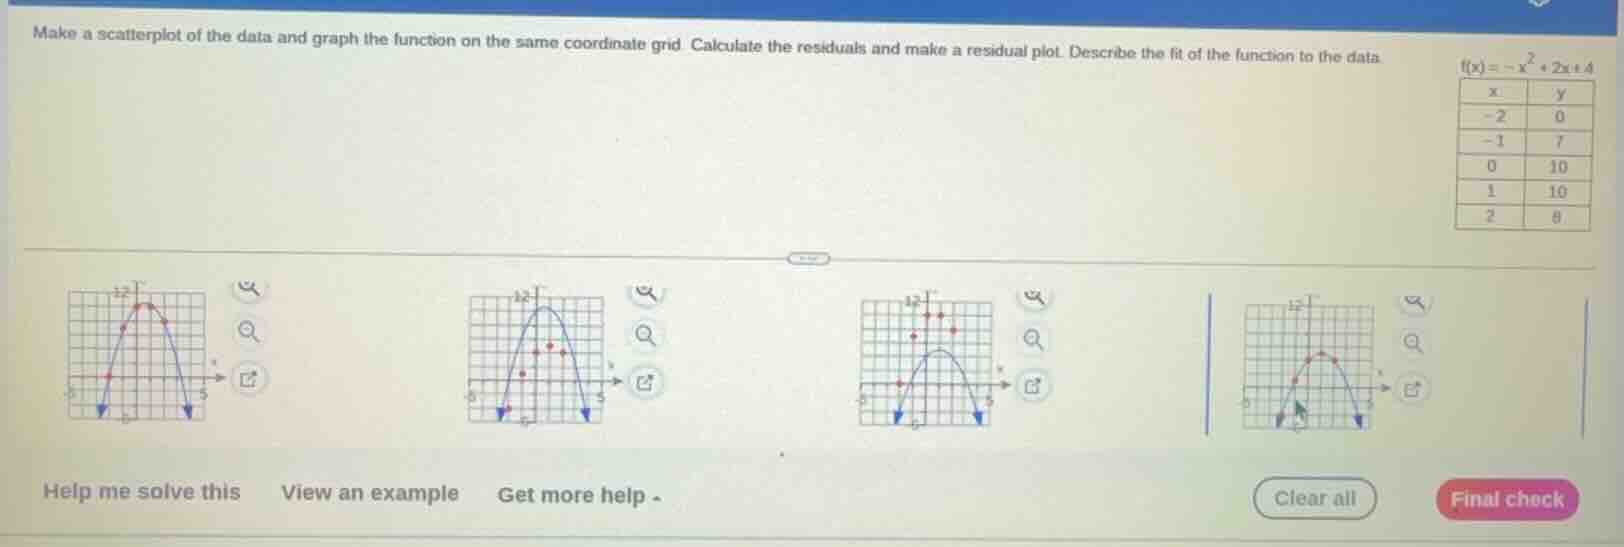
make a scatterplot of the data and graph the function on the same coordinate grid. calculate the residuals and make a residual plot. describe the fit of the function to the data.
$f(x) = -x^2 + 2x + 4$
| x | y |
|---|---|
| -1 | 7 |
| 0 | 10 |
| 1 | 10 |
| 2 | 8 |
help me solve this view an example get more help - clear all final check
Step1: Calculate predicted values
For each $x$, compute $\hat{y}=f(x)=-x^2+2x+4$:
- $x=-2$: $\hat{y}=-(-2)^2+2(-2)+4=-4-4+4=-4$
- $x=-1$: $\hat{y}=-(-1)^2+2(-1)+4=-1-2+4=1$
- $x=0$: $\hat{y}=-(0)^2+2(0)+4=4$
- $x=1$: $\hat{y}=-(1)^2+2(1)+4=-1+2+4=5$
- $x=2$: $\hat{y}=-(2)^2+2(2)+4=-4+4+4=4$
Step2: Match data to scatterplot
Plot data points $(-2,0), (-1,7), (0,10), (1,10), (2,8)$ and the parabola $y=-x^2+2x+4$. The leftmost grid matches these points and the curve.
Step3: Compute residuals
Residual = $y-\hat{y}$:
- $x=-2$: $0-(-4)=4$
- $x=-1$: $7-1=6$
- $x=0$: $10-4=6$
- $x=1$: $10-5=5$
- $x=2$: $8-4=4$
Step4: Evaluate fit
Residuals are large positive values, meaning observed $y$-values are much higher than predicted values.[LLM SSE On Failure]

Snap & solve any problem in the app
Get step-by-step solutions on Sovi AI
Photo-based solutions with guided steps
Explore more problems and detailed explanations
- Correct scatterplot + function graph: First grid (leftmost)
- Residuals: $(-2): 0 - (-(-2)^2 + 2(-2)+4) = 0 - (-4-4+4)=4$; $(-1):7 - (-(-1)^2+2(-1)+4)=7 - (-1-2+4)=6$; $(0):10 - (0+0+4)=6$; $(1):10 - (-1+2+4)=5$; $(2):8 - (-4+4+4)=4$
- Fit description: Poor fit, residuals are large and positive