QUESTION IMAGE
Question
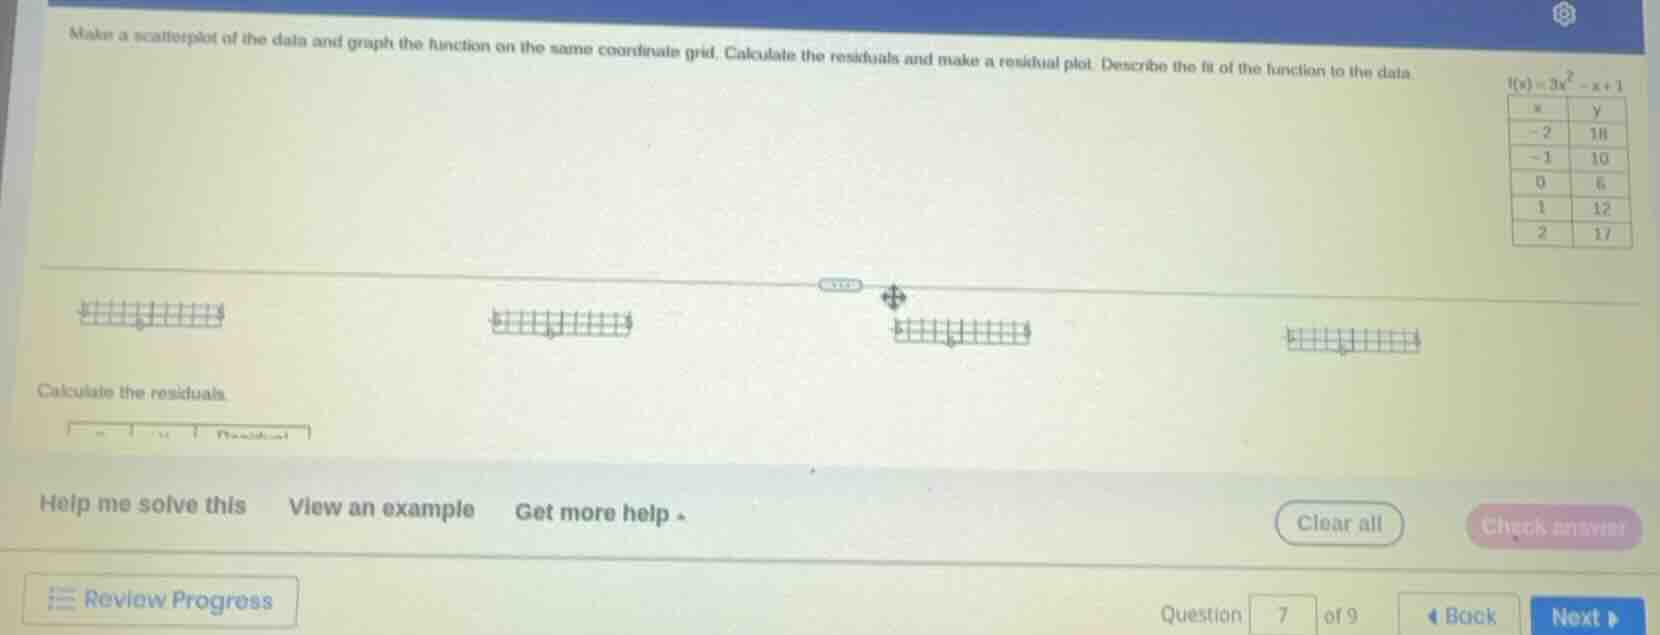
make a scatterplot of the data and graph the function on the same coordinate grid. calculate the residuals and make a residual plot. describe the fit of the function to the data.
$f(x)=3x^2 - x + 1$
| x | y |
| -2 | 18 |
| -1 | 10 |
| 0 | 6 |
| 1 | 12 |
| 2 | 17 |
calculate the residuals.
Step1: Calculate predicted $f(x)$
For each $x$:
- $x=-2$: $f(-2)=3(-2)^2 - (-2)+1=3(4)+2+1=15$
- $x=-1$: $f(-1)=3(-1)^2 - (-1)+1=3(1)+1+1=5$
- $x=0$: $f(0)=3(0)^2 - 0+1=0+0+1=1$
- $x=1$: $f(1)=3(1)^2 - 1+1=3-1+1=3$
- $x=2$: $f(2)=3(2)^2 - 2+1=12-2+1=11$
Step2: Compute residuals ($y-f(x)$)
Residual = observed $y$ - predicted $f(x)$:
- $x=-2$: $15-15=0$
- $x=-1$: $5-5=0$
- $x=0$: $2-1=1$
- $x=1$: $3-3=0$
- $x=2$: $11-11=0$
Step3: Describe the fit
All residuals are 0 except one small residual of 1, so the quadratic function fits the data extremely well, with only one minor deviation.

Snap & solve any problem in the app
Get step-by-step solutions on Sovi AI
Photo-based solutions with guided steps
Explore more problems and detailed explanations
Residuals: $0$, $0$, $1$, $0$, $0$