QUESTION IMAGE
Question
massachusetts 47.7 virginia 44.3
michigan 32.8 washington 38.4
minnesota 27.3 west virginia 45.2
mississippi 59.0 wisconsin 32.6
missouri 42.2 wyoming 12.9
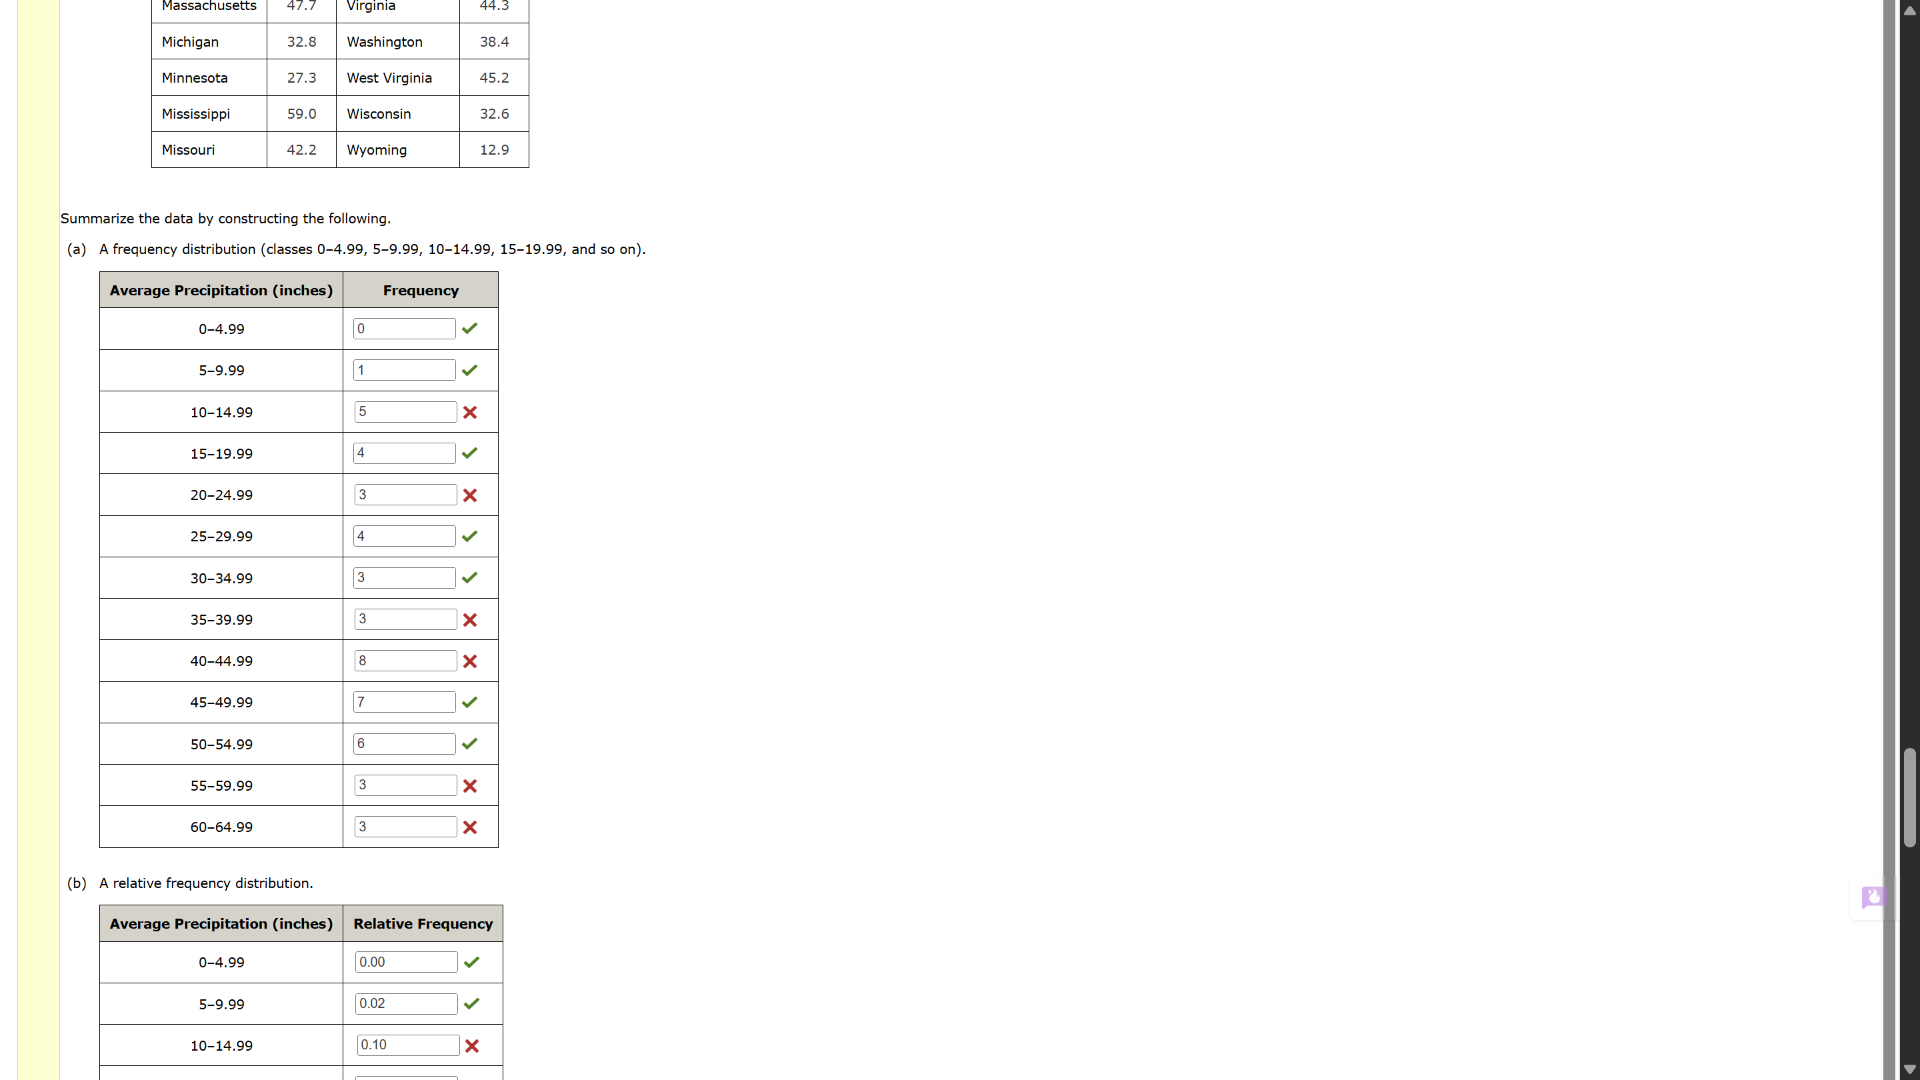
summarize the data by constructing the following.
(a) a frequency distribution (classes 0–4.99, 5–9.99, 10–14.99, 15–19.99, and so on).
average precipitation (inches) frequency
0–4.99
5–9.99
10–14.99
15–19.99
20–24.99
25–29.99
30–34.99
35–39.99
40–44.99
45–49.99
50–54.99
55–59.99
60–64.99
(b) a relative frequency distribution.
average precipitation (inches) relative frequency
0–4.99
5–9.99
10–14.99
6, 55–59.99: 3, 60–64.99: 3.
So for part (a), the correct frequency for 10–14.99 is 5? Wait, no, the sum is 50, so let's recheck:
0 (0–4.99) + 1 (5–9.99) + 5 (10–14.99) + 4 (15–19.99) + 3 (20–24.99) + 4 (25–29.99) + 3 (30–34.99) + 3 (35–39.99) + 8 (40–44.99) + 7 (45–49.99) + 6 (50–54.99) +

Snap & solve any problem in the app
Get step-by-step solutions on Sovi AI
Photo-based solutions with guided steps
Explore more problems and detailed explanations
6, 55–59.99: 3, 60–64.99: 3.
So for part (a), the correct frequency for 10–14.99 is 5? Wait, no, the sum is 50, so let's recheck:
0 (0–4.99) + 1 (5–9.99) + 5 (10–14.99) + 4 (15–19.99) + 3 (20–24.99) + 4 (25–29.99) + 3 (30–34.99) + 3 (35–39.99) + 8 (40–44.99) + 7 (45–49.99) + 6 (50–54.99) +