QUESTION IMAGE
Question
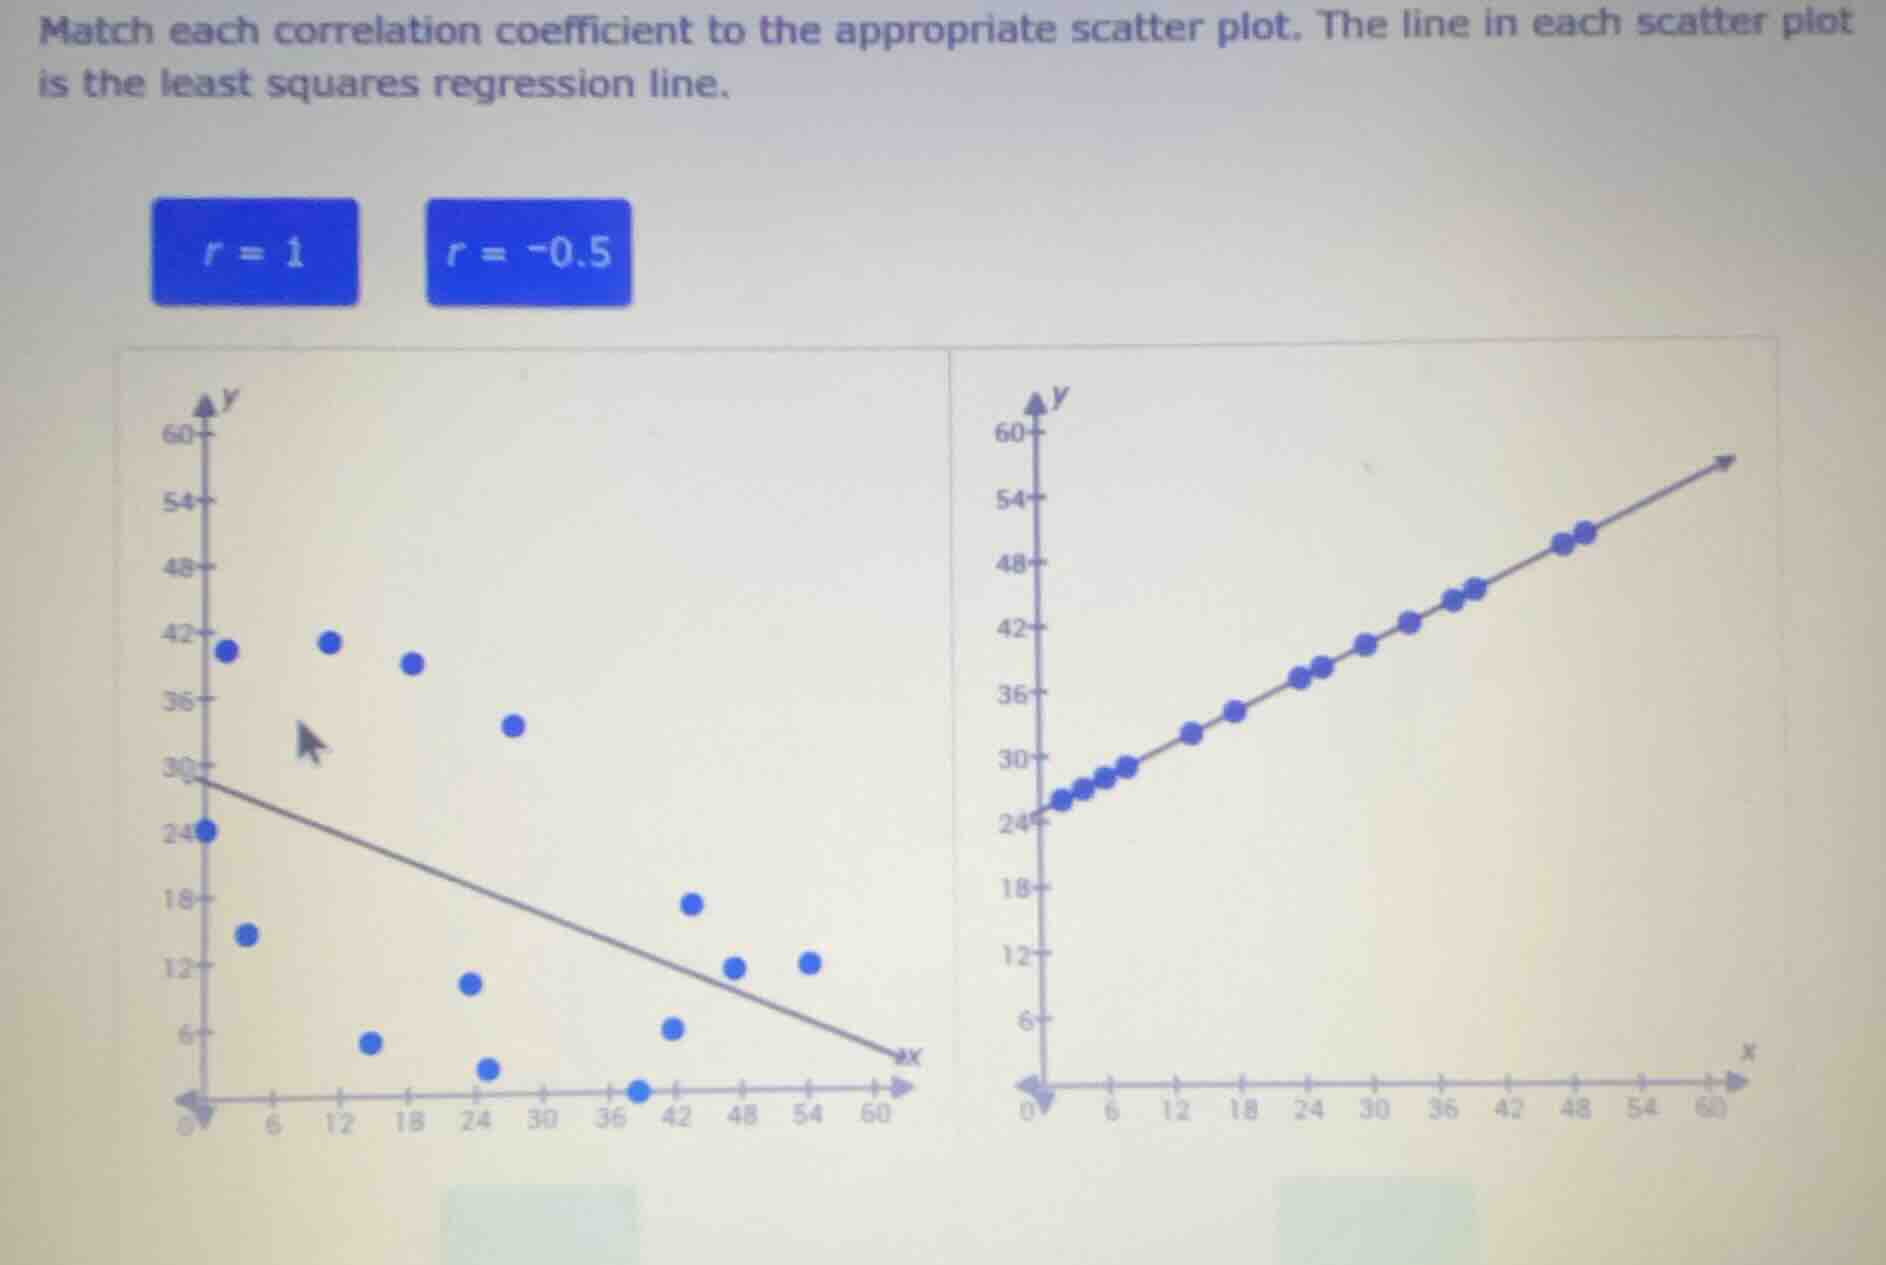
match each correlation coefficient to the appropriate scatter plot. the line in each scatter plot is the least squares regression line.
r = 1 r = -0.5
Step1: Analyze right scatter plot
All points lie exactly on an upward-sloping regression line, indicating a perfect positive linear relationship. A perfect positive correlation has a coefficient $r=1$.
Step2: Analyze left scatter plot
Points are scattered around a downward-sloping regression line, showing a moderate negative linear relationship. This matches the coefficient $r=-0.5$.

Snap & solve any problem in the app
Get step-by-step solutions on Sovi AI
Photo-based solutions with guided steps
Explore more problems and detailed explanations
- Left scatter plot: $r = -0.5$
- Right scatter plot: $r = 1$