QUESTION IMAGE
Question
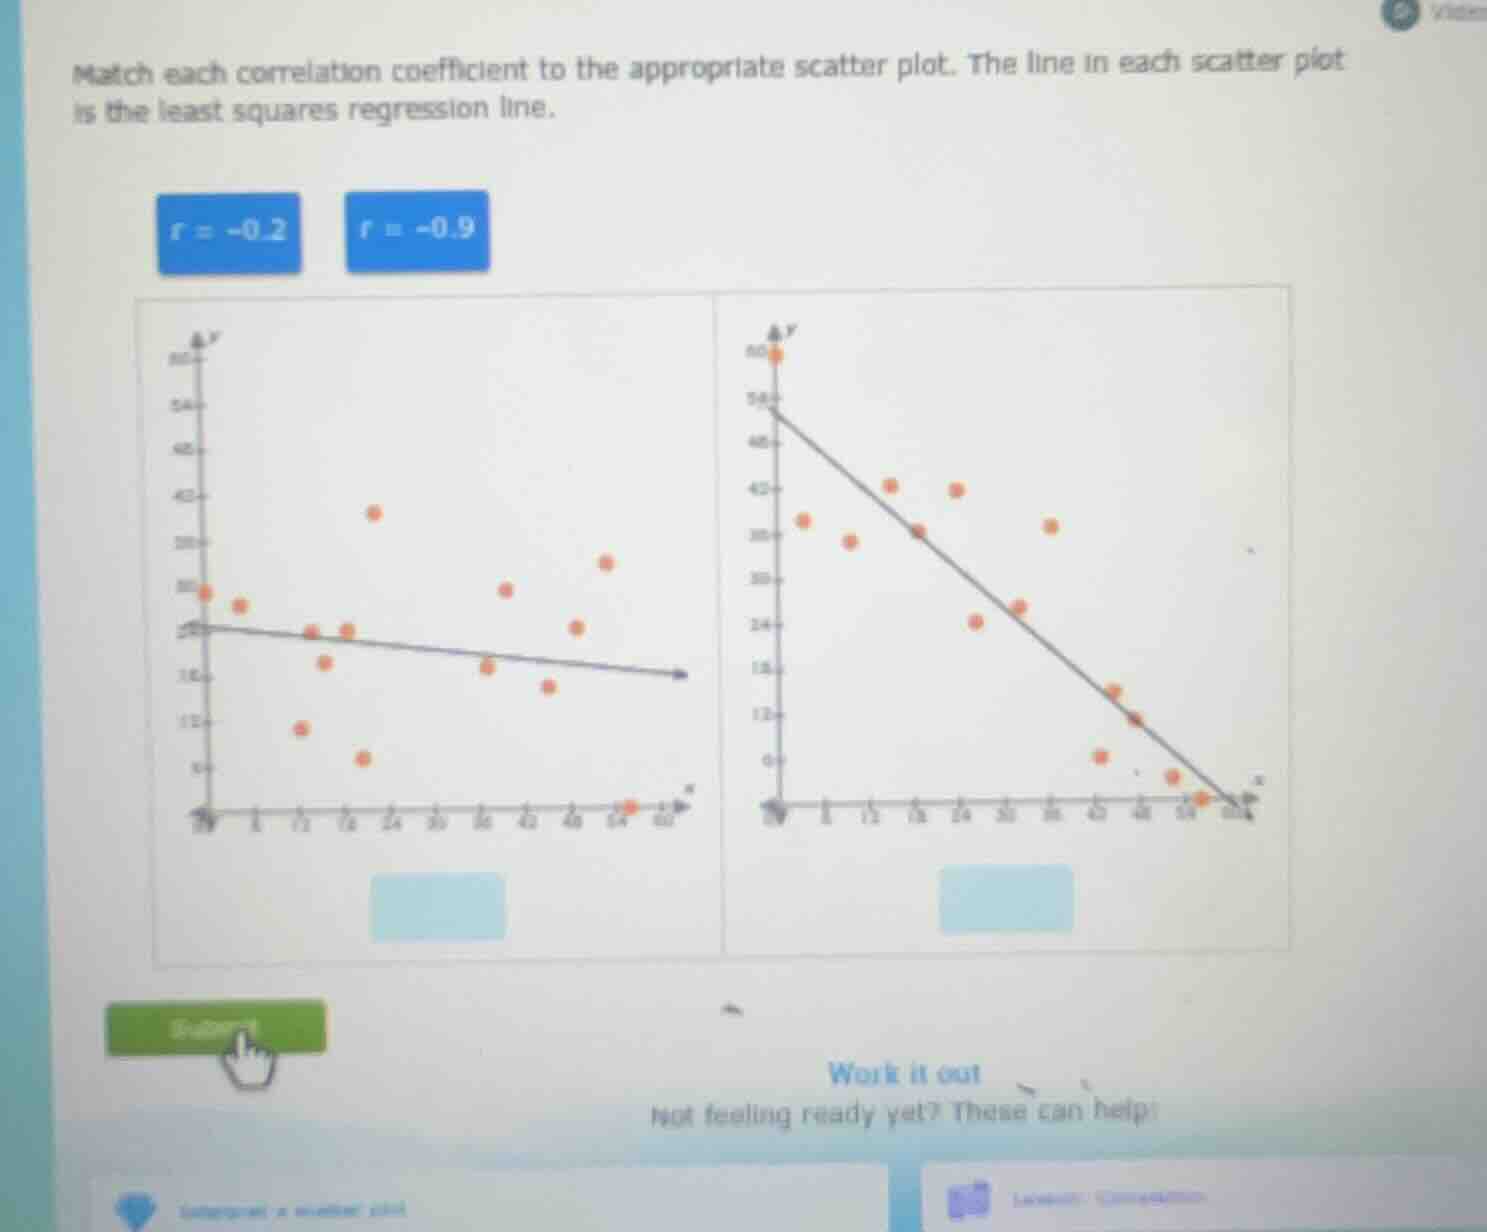
match each correlation coefficient to the appropriate scatter plot. the line in each scatter plot is the least squares regression line.
r = -0.2 r = -0.9
Step1: Recall correlation coefficient meaning
The correlation coefficient \( r \) measures the strength and direction of a linear relationship. Values close to \( \pm1 \) mean a strong linear relationship, values close to 0 mean a weak linear relationship. Negative \( r \) means negative (downward) linear trend.
Step2: Analyze \( r = -0.2 \)
\( r = -0.2 \) is close to 0, so the linear relationship is weak. The left scatter plot has points more spread out around the regression line (weaker linear trend), so it matches \( r = -0.2 \).
Step3: Analyze \( r = -0.9 \)
\( r = -0.9 \) is close to -1, so the linear relationship is strong. The right scatter plot has points close to the regression line (stronger linear trend), so it matches \( r = -0.9 \).

Snap & solve any problem in the app
Get step-by-step solutions on Sovi AI
Photo-based solutions with guided steps
Explore more problems and detailed explanations
Left scatter plot: \( r = -0.2 \)
Right scatter plot: \( r = -0.9 \)