QUESTION IMAGE
Question
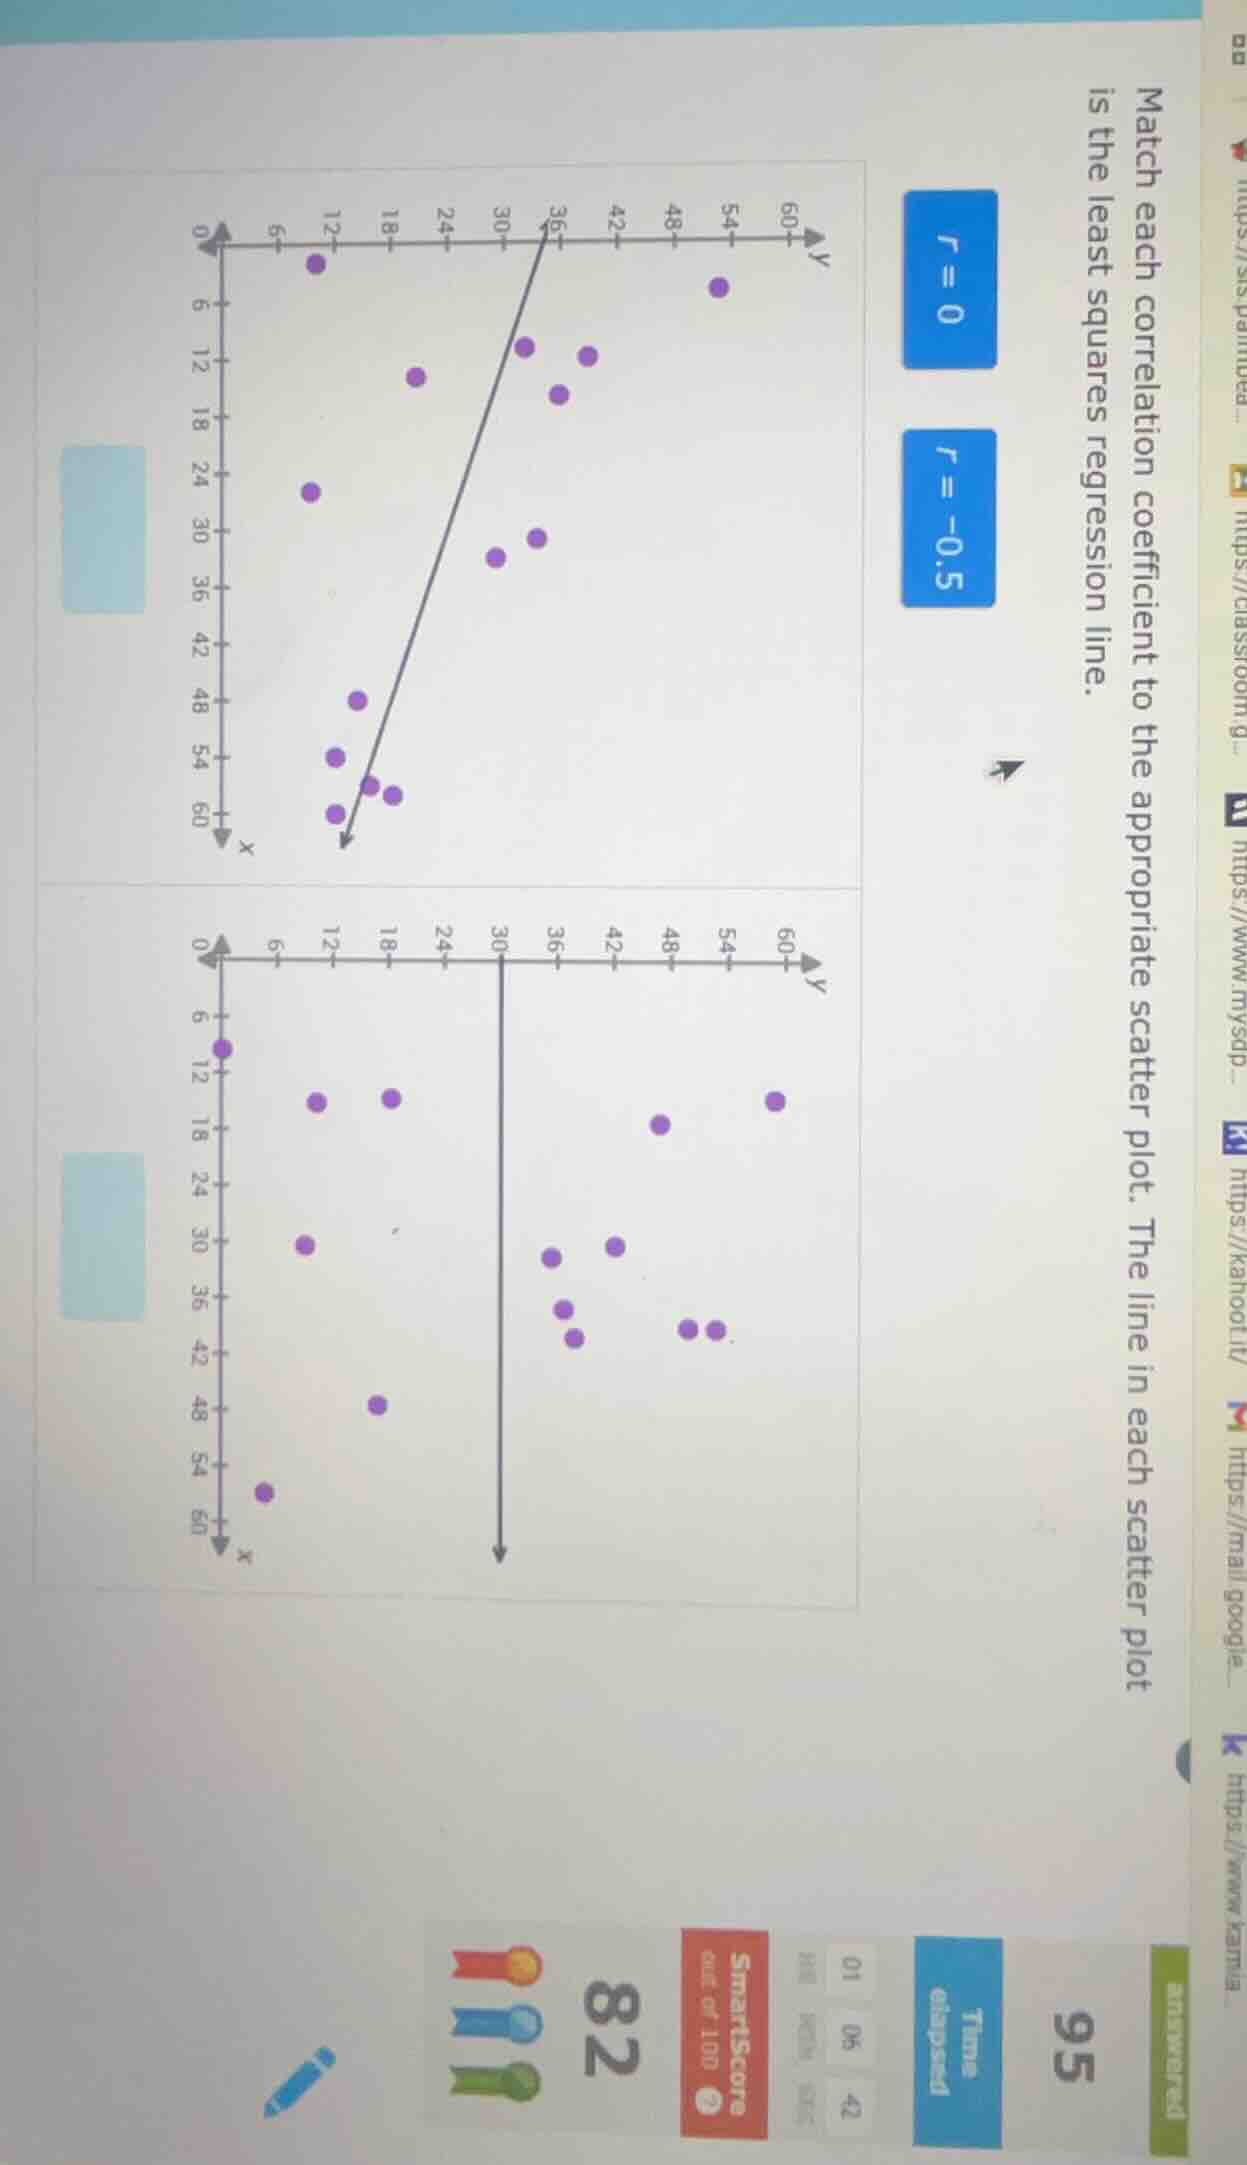
match each correlation coefficient to the appropriate scatter plot. the line in each scatter plot is the least squares regression line.
(scatter plots and correlation coefficient options: r = 0, r = -0.5, and two scatter plots with regression lines)
Step1: Analyze top scatter plot
The top plot has a downward-sloping regression line, showing a negative linear relationship between $x$ and $y$, so it matches $r=-0.5$.
Step2: Analyze bottom scatter plot
The bottom plot has a vertical regression line, meaning there is no linear association between $x$ and $y$, so it matches $r=0$.

Snap & solve any problem in the app
Get step-by-step solutions on Sovi AI
Photo-based solutions with guided steps
Explore more problems and detailed explanations
Top scatter plot: $r=-0.5$
Bottom scatter plot: $r=0$