QUESTION IMAGE
Question
mathematics progress check
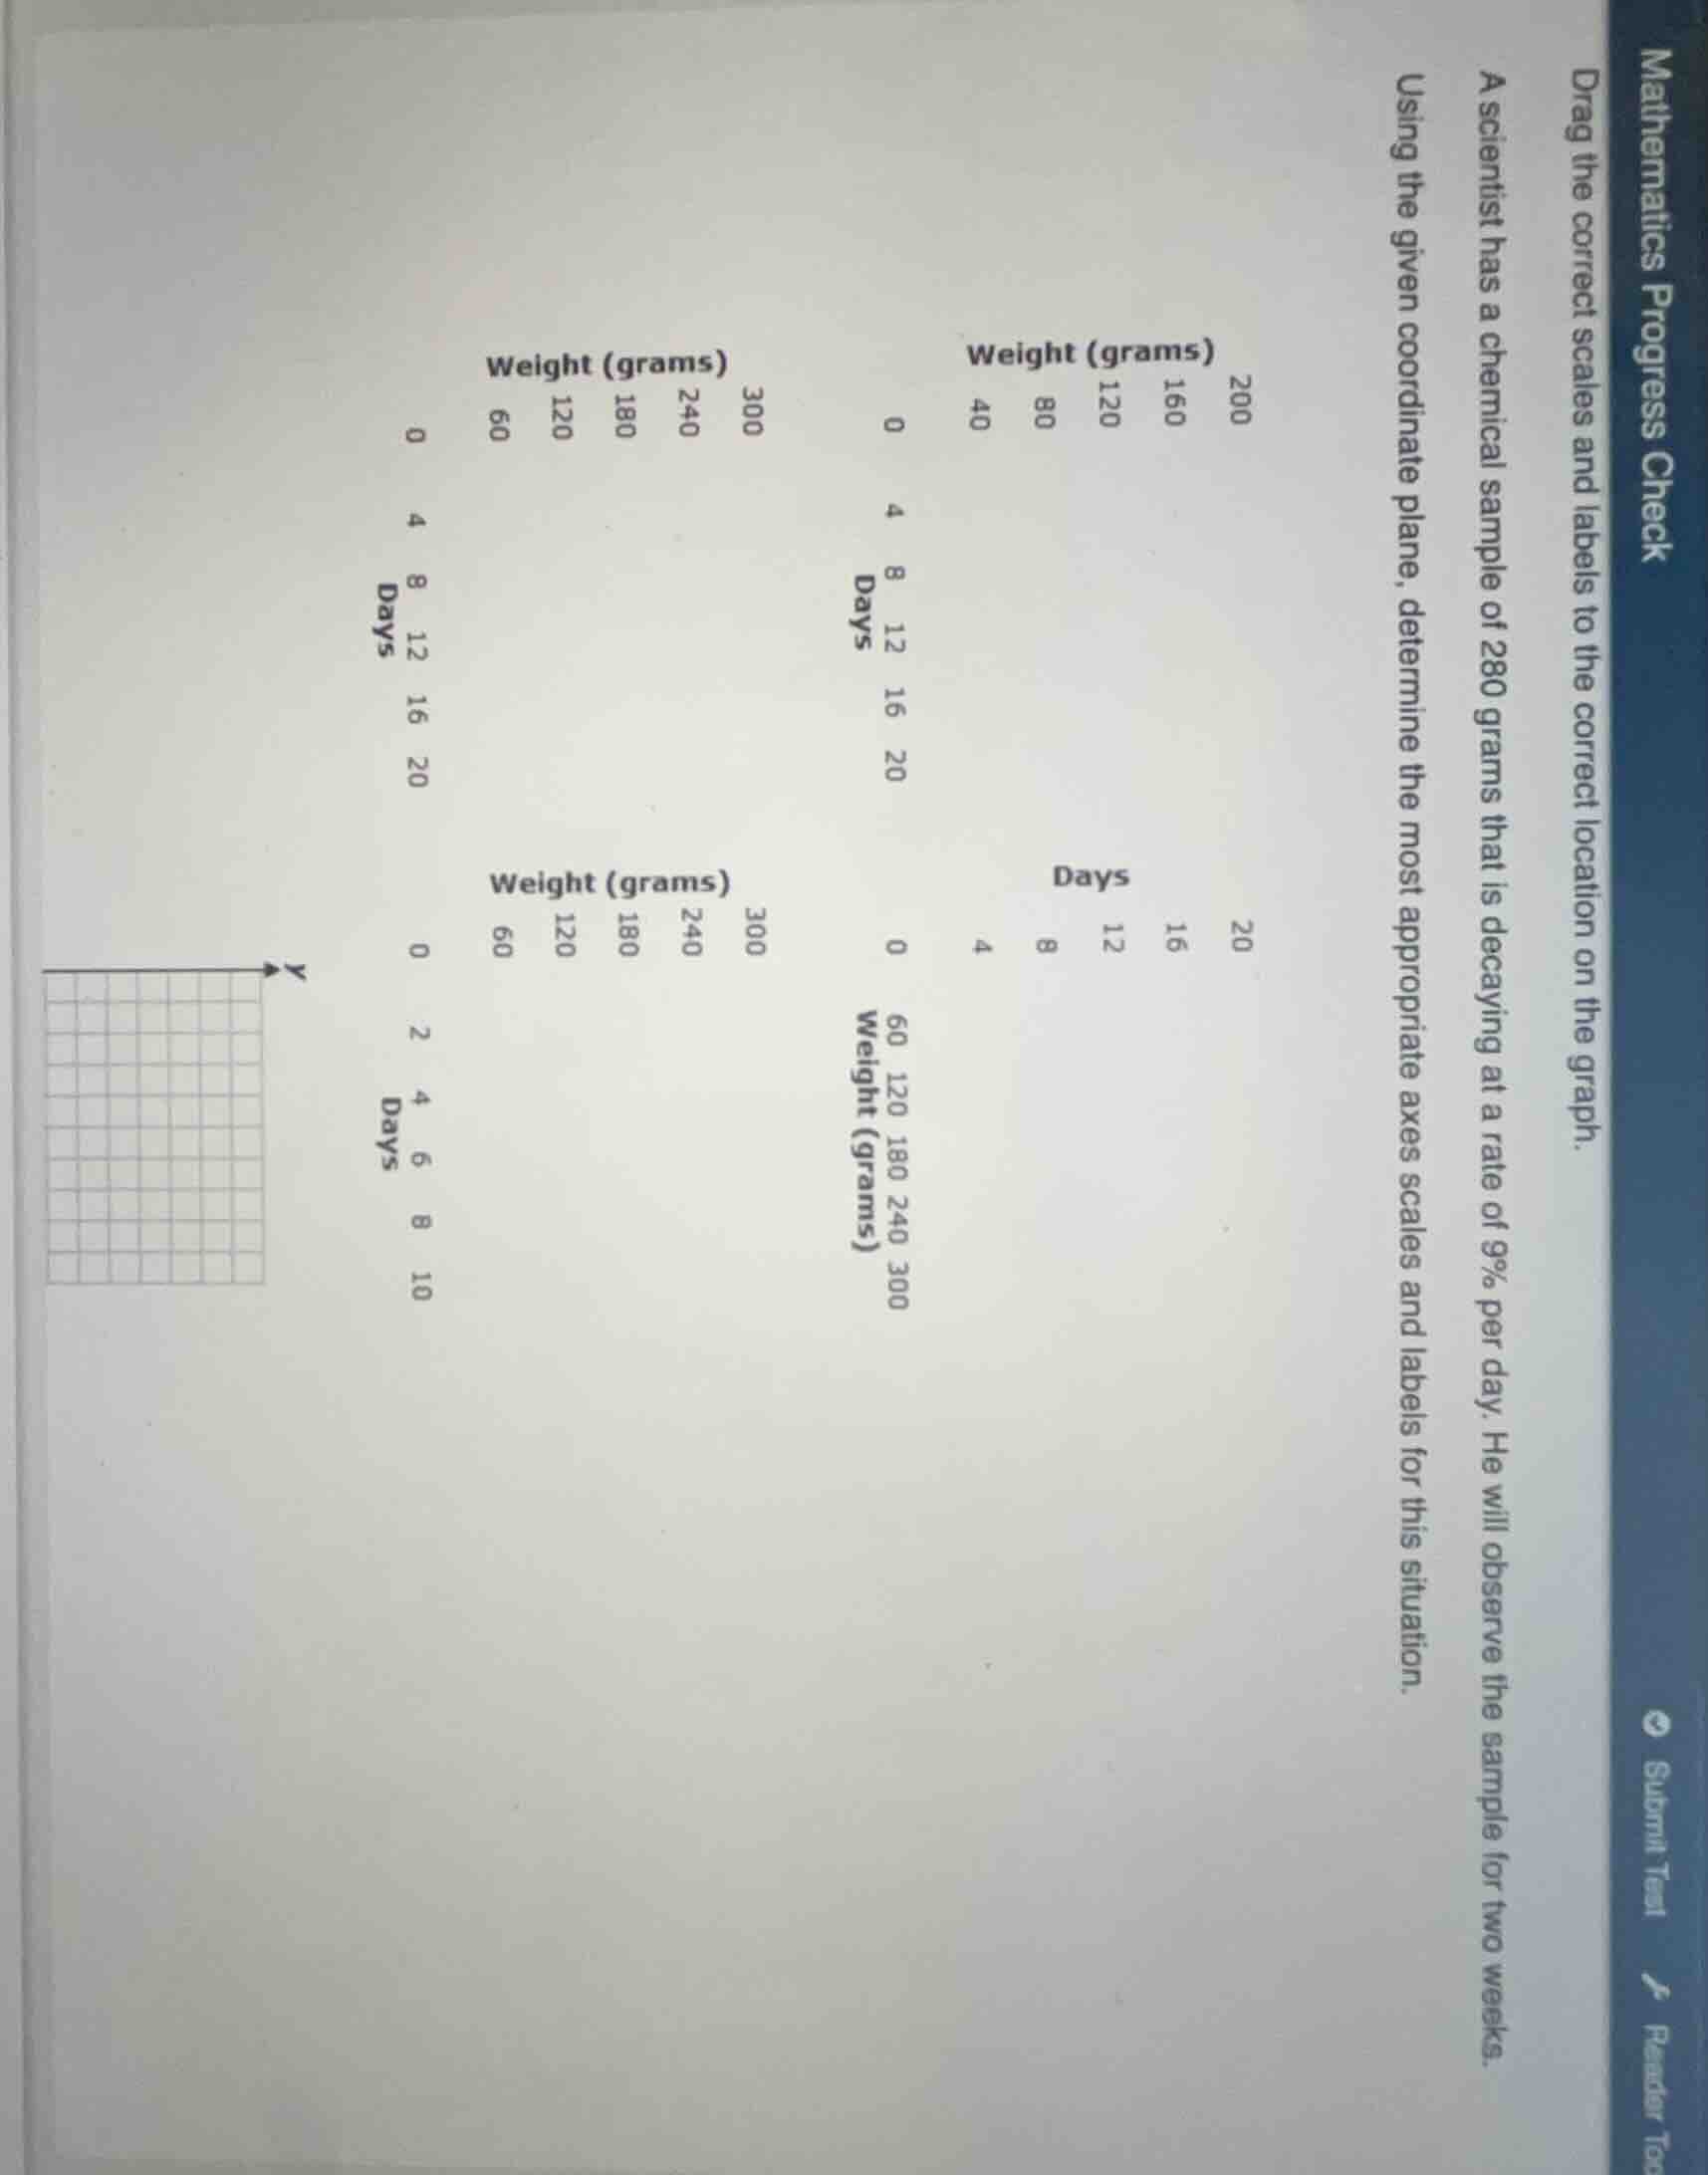
drag the correct scales and labels to the correct location on the graph.
a scientist has a chemical sample of 280 grams that is decaying at a rate of 9% per day. he will observe the sample for two weeks.
using the given coordinate plane, determine the most appropriate axes scales and labels for this situation.
weight (grams)
200
160
120
80
40
0
days
4 8 12 16 20
weight (grams)
300
240
180
120
60
0
days
0 4 8 12 16 20
weight (grams)
300
240
180
120
60
0
days
0 2 4 6 8 10
weight (grams)
300
240
180
120
60
0
days
0 4 8 12 16 20
Step1: Identify independent variable
The independent variable (x-axis) is time in days, with a maximum observation period of 14 days (2 weeks). The scale with days 0,4,8,12,16,20 covers this range appropriately.
Step2: Identify dependent variable
The dependent variable (y-axis) is weight in grams, starting at 280 grams. The scale with weights 0,60,120,180,240,300 can accommodate the initial weight and subsequent decay values.
Step3: Assign axes labels
Label the x-axis (horizontal) as "Days" with the scale 0,4,8,12,16,20. Label the y-axis (vertical) as "Weight (grams)" with the scale 0,60,120,180,240,300.

Snap & solve any problem in the app
Get step-by-step solutions on Sovi AI
Photo-based solutions with guided steps
Explore more problems and detailed explanations
- X-axis (horizontal): Label = "Days", Scale = 0, 4, 8, 12, 16, 20
- Y-axis (vertical): Label = "Weight (grams)", Scale = 0, 60, 120, 180, 240, 300