QUESTION IMAGE
Question
maximum mark: 7
23n.2.sl.tz1.1
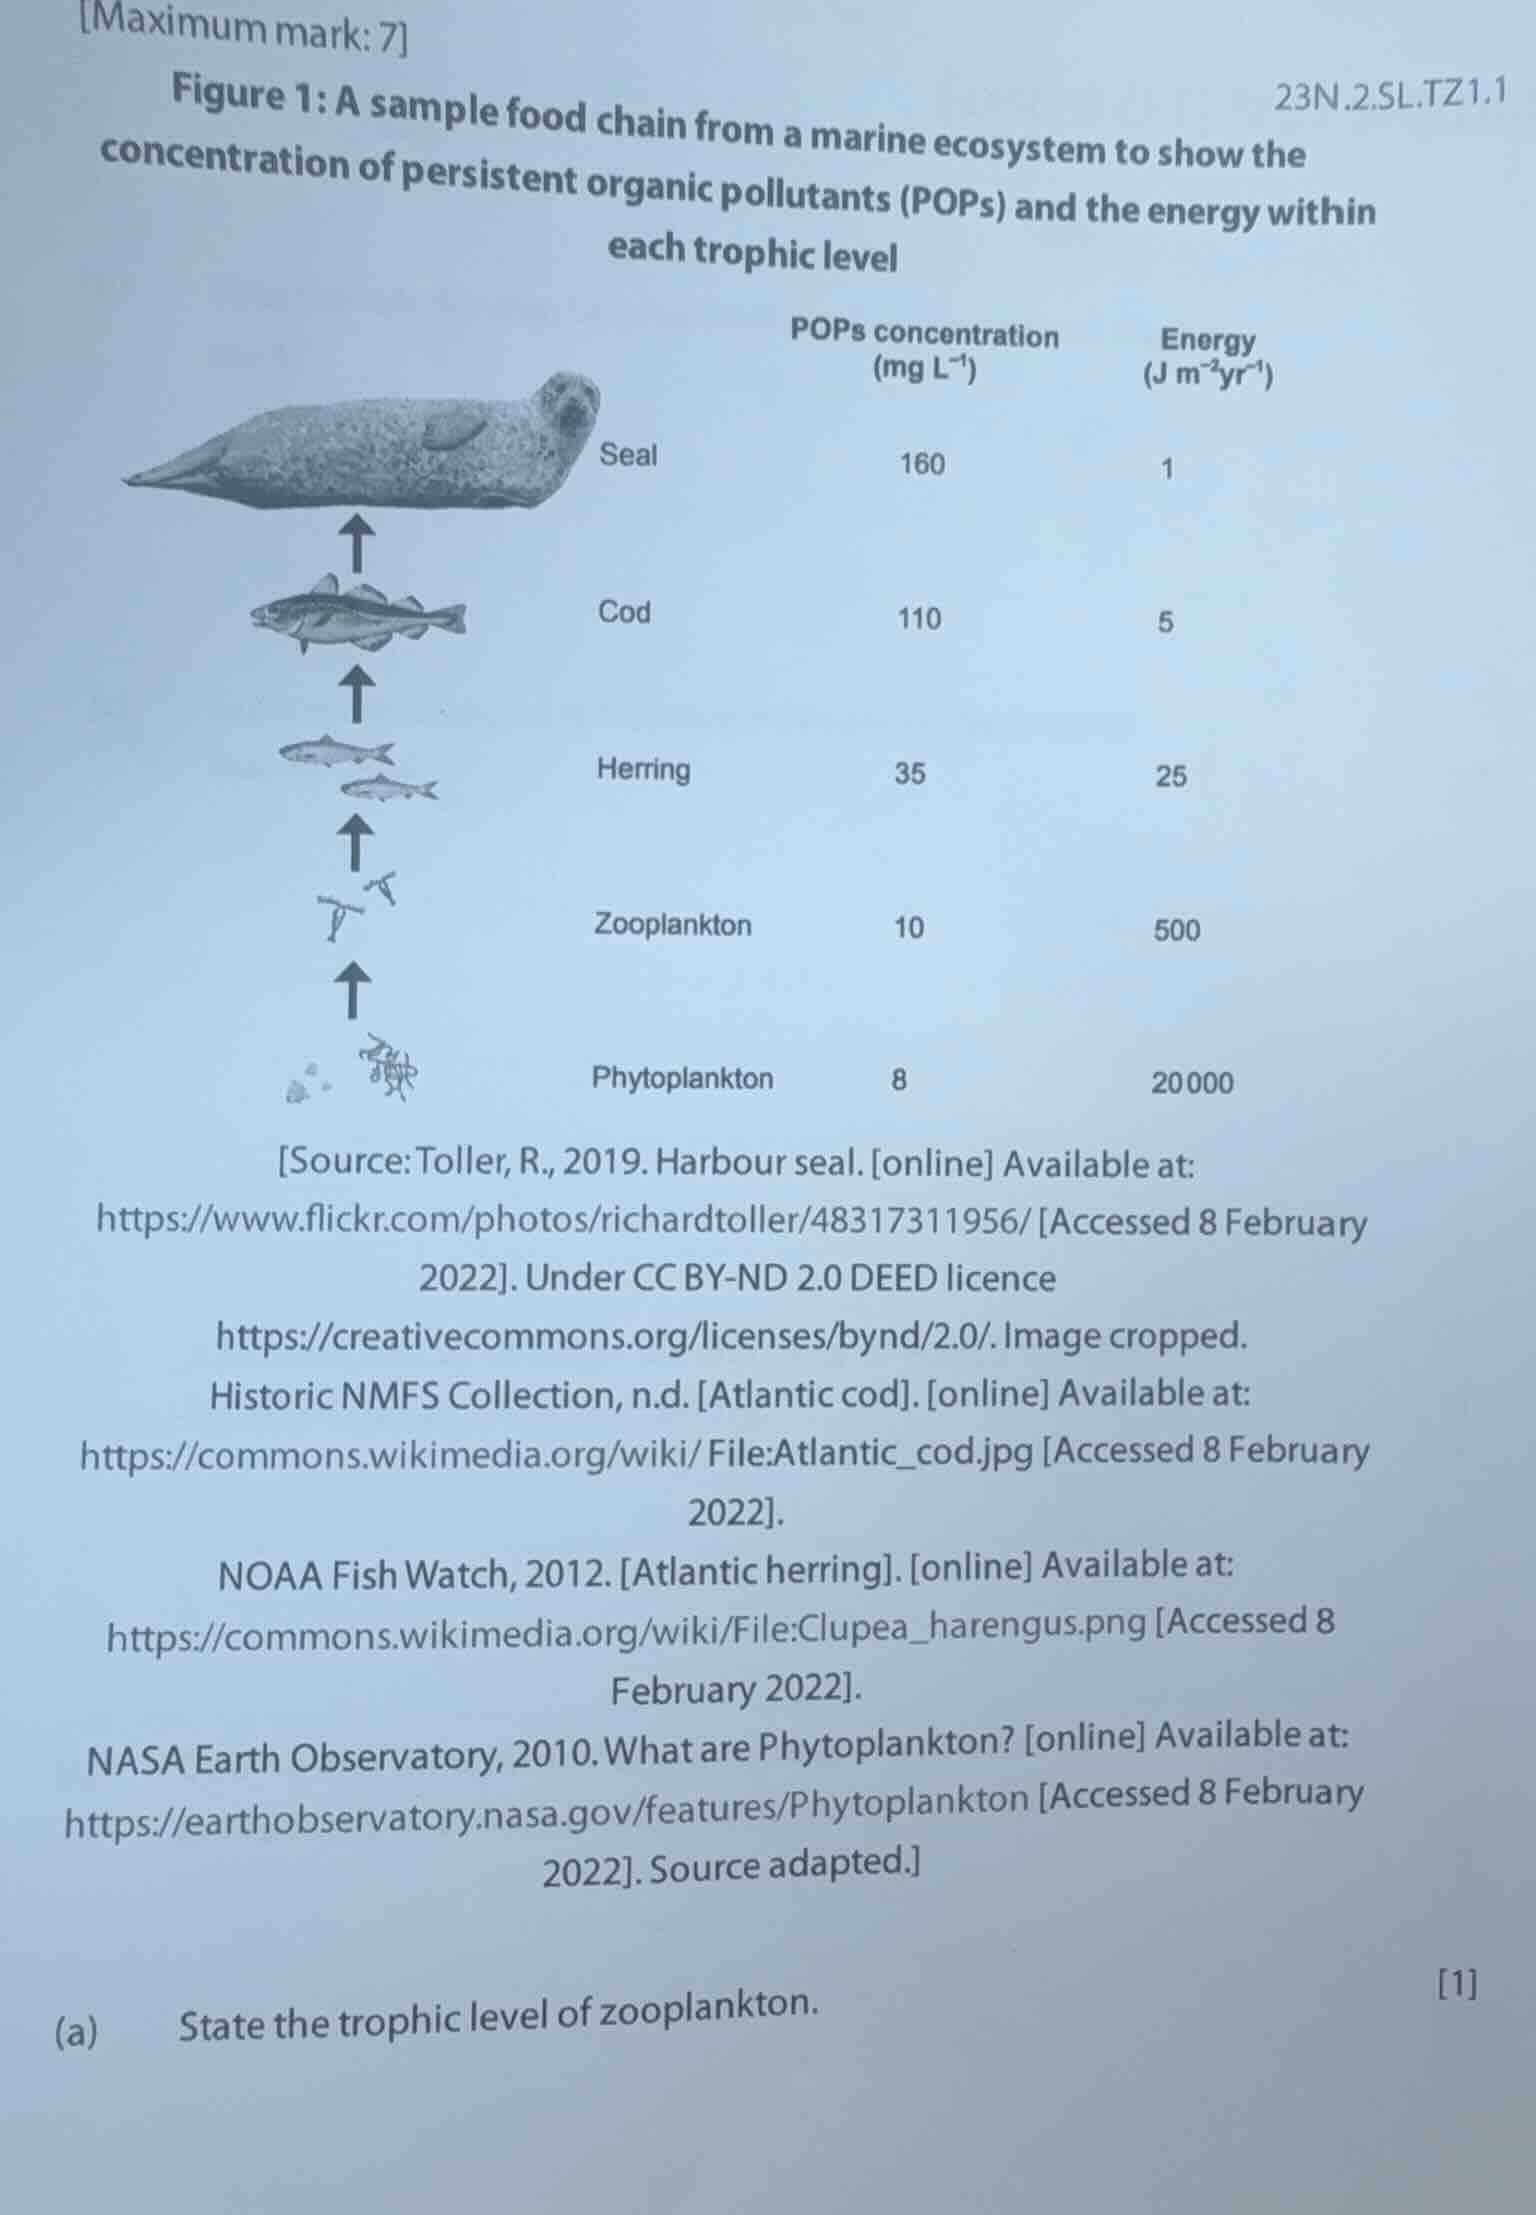
figure 1: a sample food chain from a marine ecosystem to show the concentration of persistent organic pollutants (pops) and the energy within each trophic level
pops concentration (mg l⁻¹)
energy (j m⁻²yr⁻¹)
seal: 160, 1
cod: 110, 5
herring: 35, 25
zooplankton: 10, 500
phytoplankton: 8, 20000
source:toller, r., 2019. harbour seal. online available at: https://www.flickr.com/photos/richardtoller/48317311956/ accessed 8 february 2022. under cc by-nd 2.0 deed licence https://creativecommons.org/licenses/bynd/2.0/. image cropped.
historic nmfs collection, n.d. atlantic cod. online available at: https://commons.wikimedia.org/wiki/file:atlantic_cod.jpg accessed 8 february 2022.
noaa fish watch, 2012. atlantic herring. online available at: https://commons.wikimedia.org/wiki/file:clupea_harengus.png accessed 8 february 2022.
nasa earth observatory, 2010. what are phytoplankton? online available at: https://earthobservatory.nasa.gov/features/phytoplankton accessed 8 february 2022. source adapted.
(a) state the trophic level of zooplankton. 1
Zooplankton feeds on phytoplankton, which are producers (trophic level 1). Organisms that eat producers are primary consumers, occupying trophic level 2.

Snap & solve any problem in the app
Get step-by-step solutions on Sovi AI
Photo-based solutions with guided steps
Explore more problems and detailed explanations
Trophic level 2 (primary consumer)