QUESTION IMAGE
Question
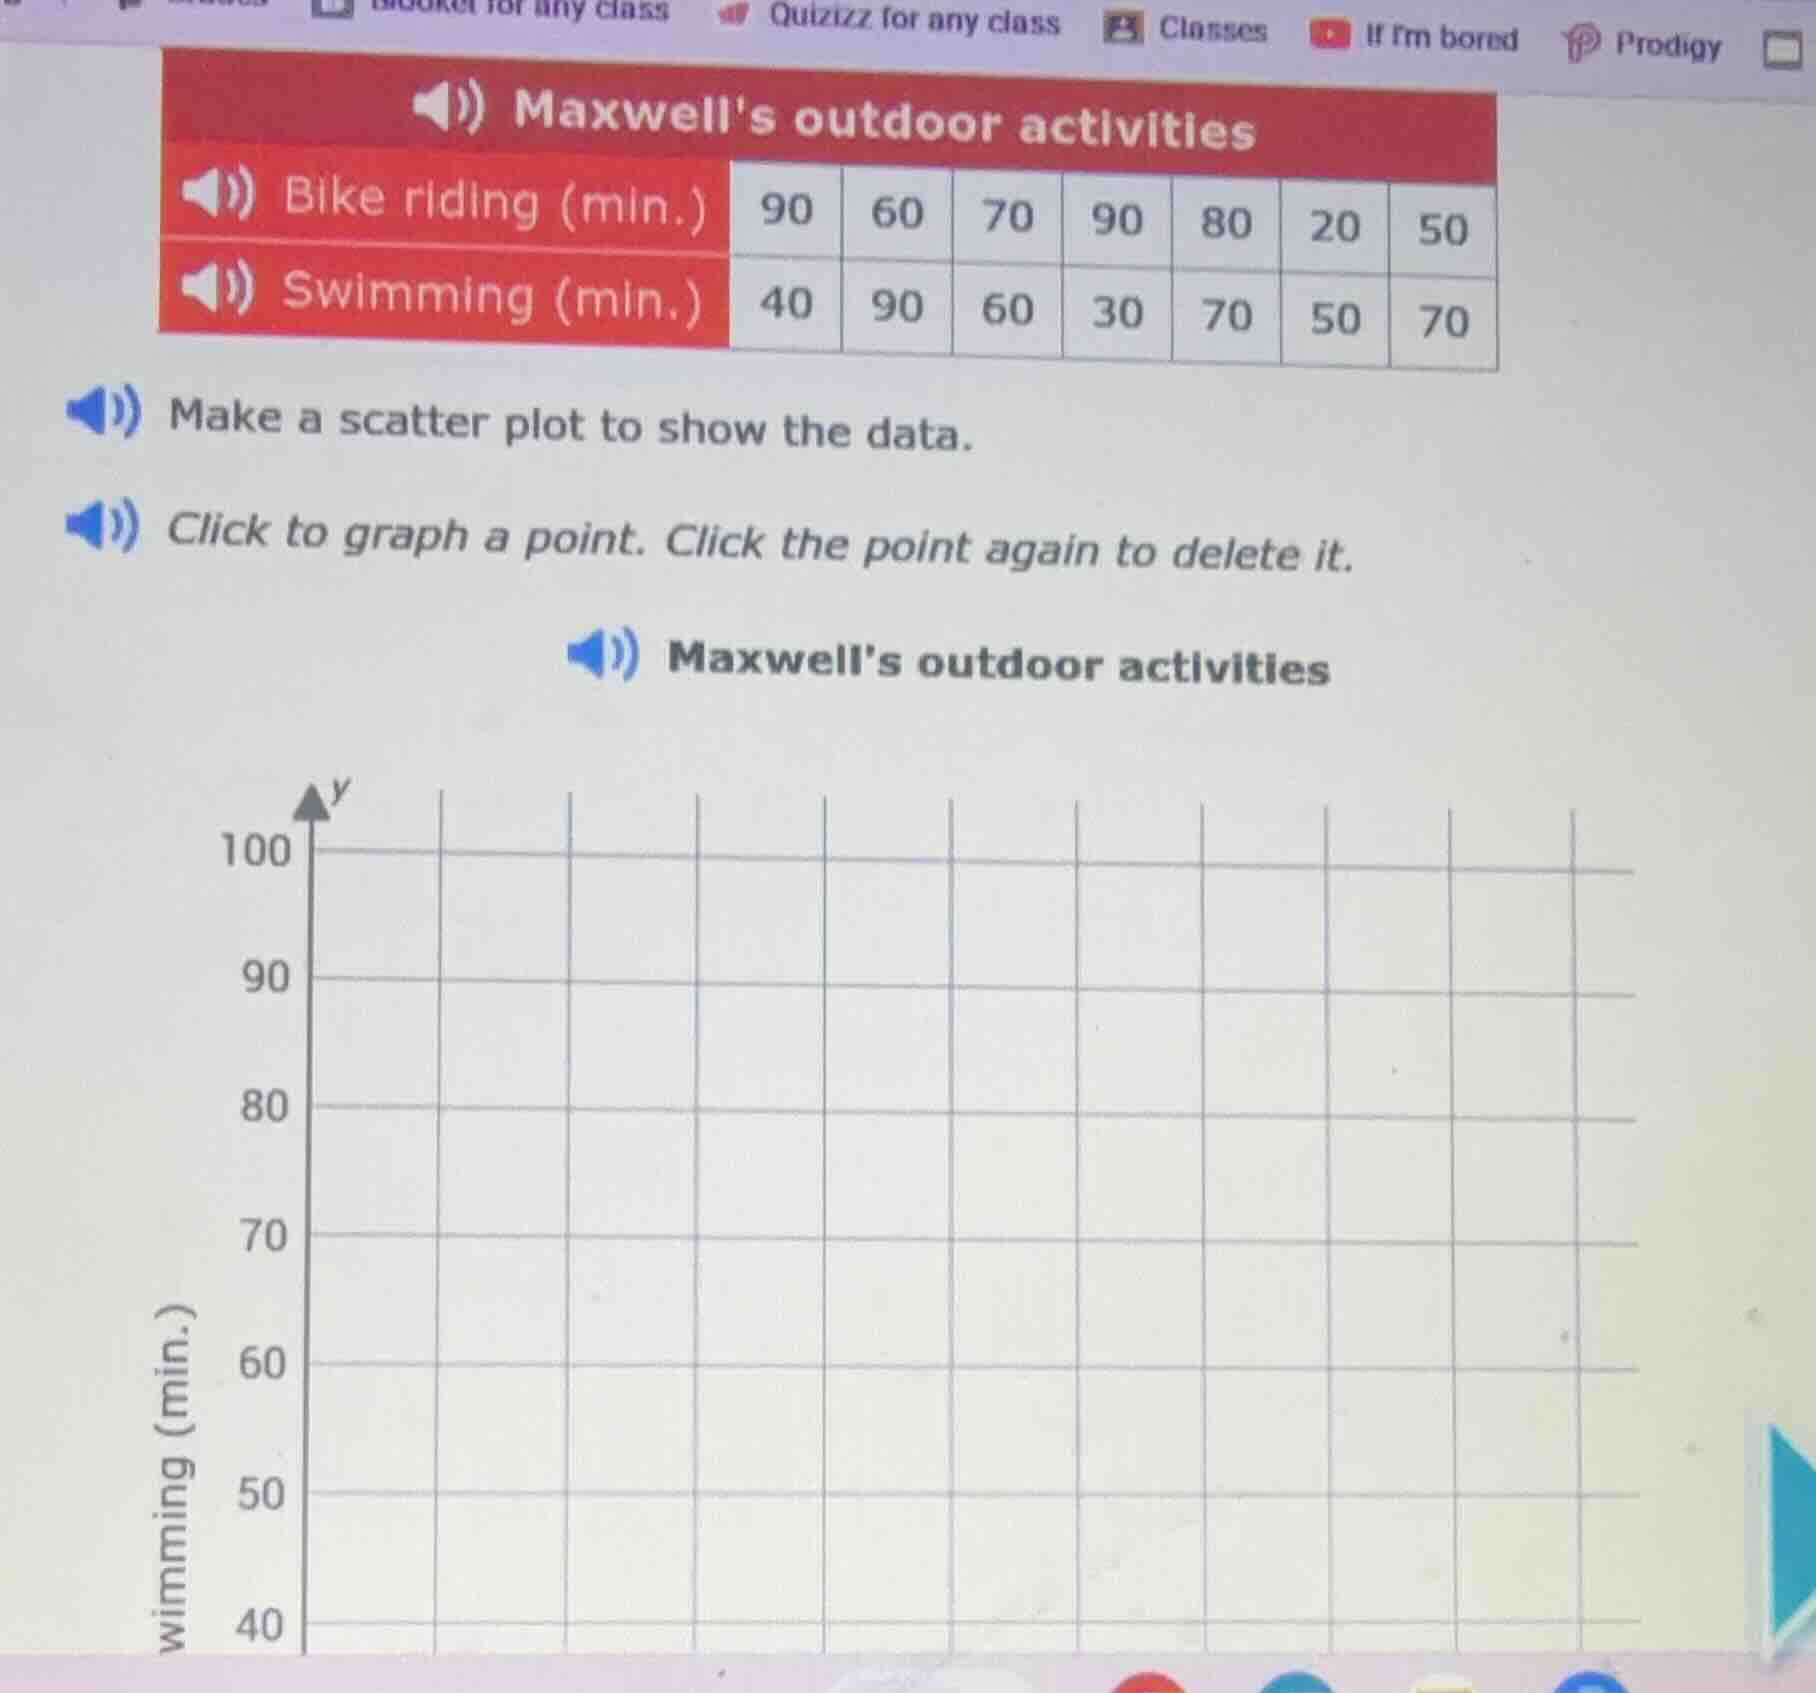
maxwells outdoor activities
bike riding (min.) 90 60 70 90 80 20 50
swimming (min.) 40 90 60 30 70 50 70
make a scatter plot to show the data.
click to graph a point. click the point again to delete it.
maxwells outdoor activities
(graph with y - axis labeled swimming (min.) from 40 to 100 and grid lines)
Step1: Identify data pairs
Bike riding (x) and Swimming (y) pairs: (90,40), (60,90), (70,60), (90,30), (80,70), (20,50), (50,70)
Step2: Plot each point
- For (90,40): x=90, y=40
- For (60,90): x=60, y=90
- For (70,60): x=70, y=60
- For (90,30): x=90, y=30
- For (80,70): x=80, y=70
- For (20,50): x=20, y=50
- For (50,70): x=50, y=70

Snap & solve any problem in the app
Get step-by-step solutions on Sovi AI
Photo-based solutions with guided steps
Explore more problems and detailed explanations
Plot the points (90,40), (60,90), (70,60), (90,30), (80,70), (20,50), (50,70) on the scatter plot with x - axis as Bike riding (min.) and y - axis as Swimming (min.).