QUESTION IMAGE
Question
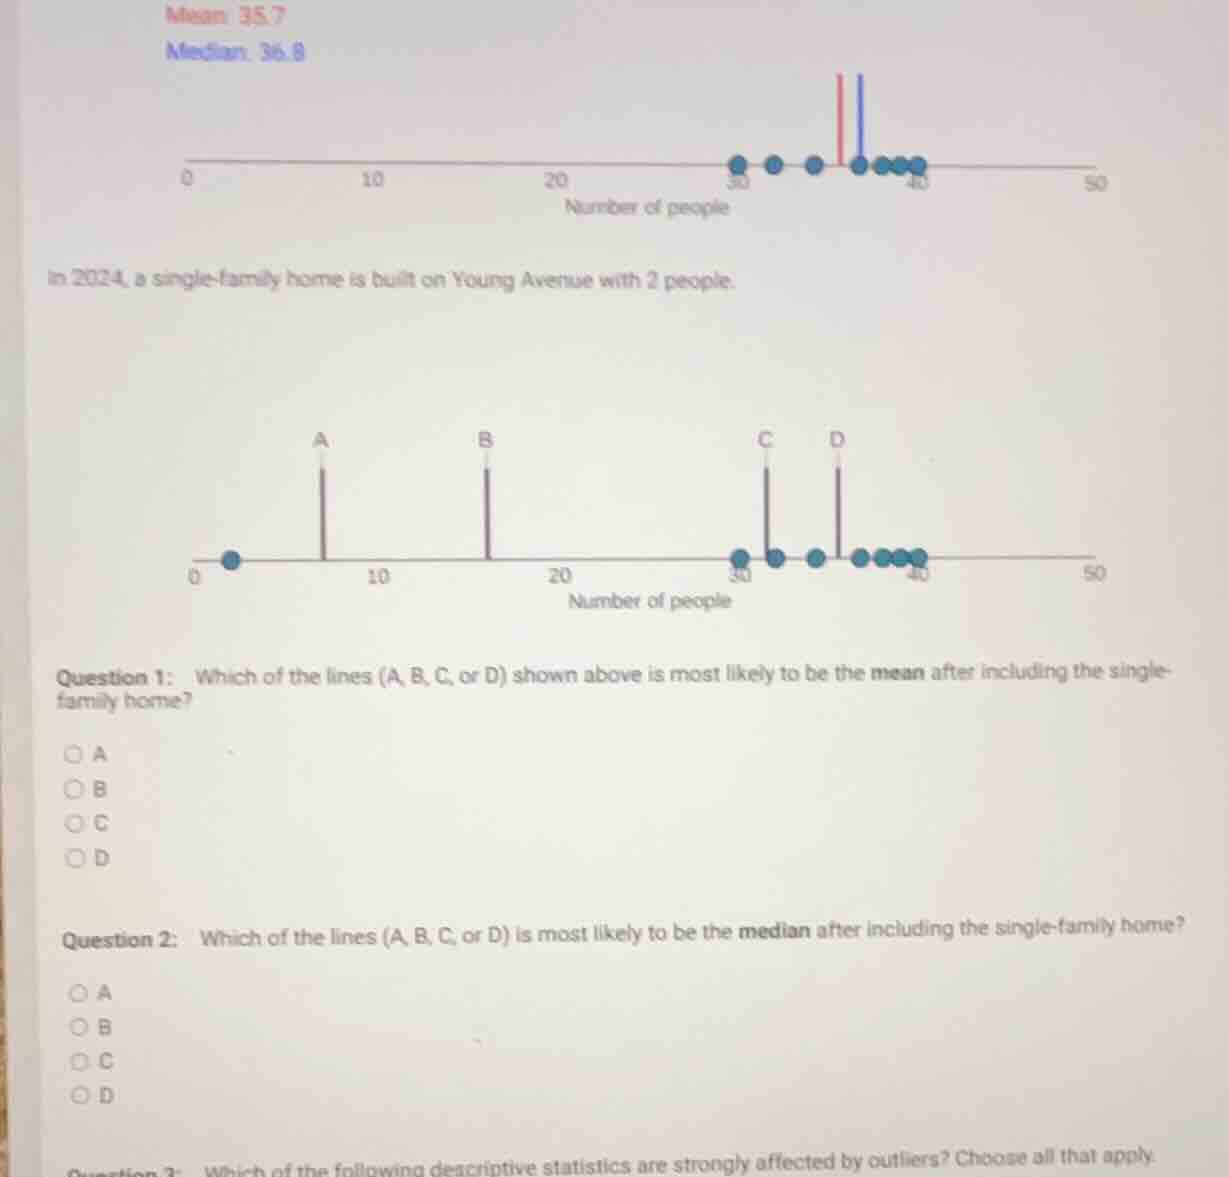
mean: 35.7
median: 36.8
0 10 20 30 40 50
number of people
in 2024, a single - family home is built on young avenue with 2 people.
0 10 20 30 40 50
number of people
question 1: which of the lines (a, b, c, or d) shown above is most likely to be the mean after including the single - family home?
a
b
c
d
question 2: which of the lines (a, b, c, or d) is most likely to be the median after including the single - family home?
a
b
c
d
question 3: which of the following descriptive statistics are strongly affected by outliers? choose all that apply.
Step1: Analyze original data count
First, count the original data points: there are 7 points (30, 32, 34, 36, 38, 38, 40).
Step2: Calculate original total population
Original total = $30 + 32 + 34 + 36 + 38 + 38 + 40 = 248$
Step3: Update total with new data
Add the new value 2: New total = $248 + 2 = 250$; New count = $7 + 1 = 8$
Step4: Compute new mean
New mean = $\frac{250}{8} = 31.25$, which is close to line C.
Step5: Find new median
For 8 data points, median is average of 4th and 5th ordered values. Ordered data: 2, 30, 32, 34, 36, 38, 38, 40.
New median = $\frac{34 + 36}{2} = 35$, which is close to line D.
Step6: Identify outlier-sensitive stats
Mean is strongly affected by outliers; median is not.

Snap & solve any problem in the app
Get step-by-step solutions on Sovi AI
Photo-based solutions with guided steps
Explore more problems and detailed explanations
Question 1: C. Line C
Question 2: D. Line D
Question 3: Mean (Note: Since the full options for Q3 are not shown, the key outlier-sensitive descriptive statistic here is the mean)