QUESTION IMAGE
Question
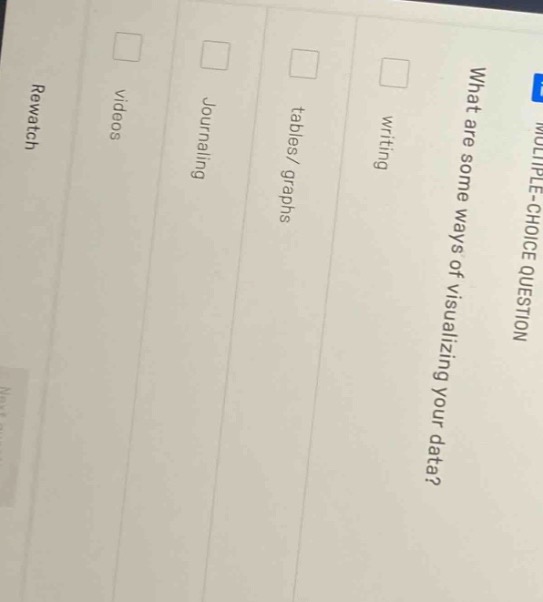
multiple-choice question what are some ways of visualizing your data? writing tables/ graphs journaling videos rewatch
Brief Explanations
To determine the way of visualizing data, we analyze each option:
- "writing" is for documenting, not visualizing data.
- "tables/graphs" are standard tools to represent data visually (e.g., bar graphs, pie charts, tables to organize data).
- "journaling" is for recording thoughts, not data visualization.
- "videos" are more for multimedia presentation, not typical data visualization. So the correct option related to data visualization is tables/graphs.

Snap & solve any problem in the app
Get step-by-step solutions on Sovi AI
Photo-based solutions with guided steps
Explore more problems and detailed explanations
tables/ graphs (the option corresponding to "tables/ graphs" should be selected as it is a way to visualize data, while writing, journaling, and videos are not primary methods for data visualization)