QUESTION IMAGE
Question
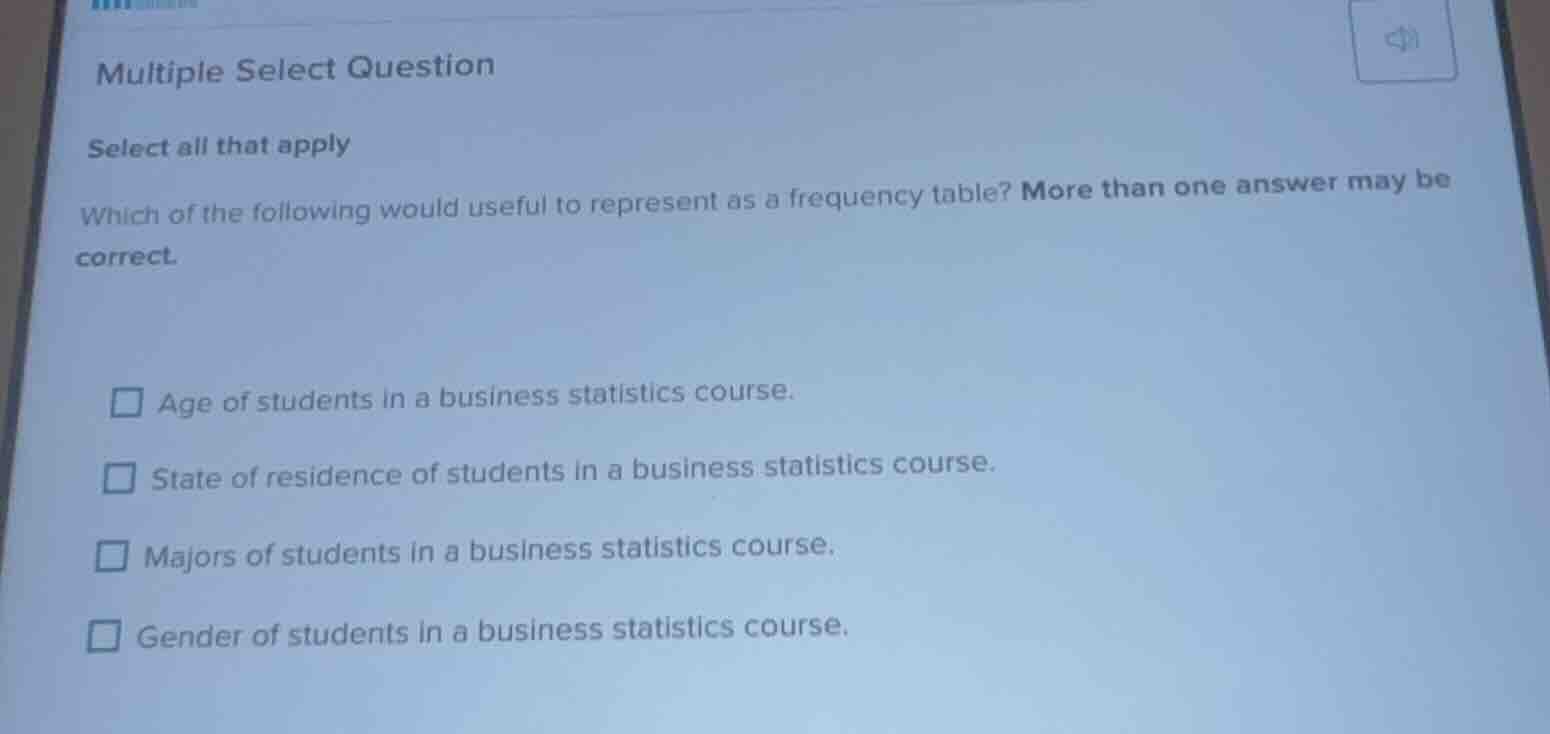
multiple select question
select all that apply
which of the following would useful to represent as a frequency table? more than one answer may be correct.
age of students in a business statistics course.
state of residence of students in a business statistics course.
majors of students in a business statistics course.
gender of students in a business statistics course.
A frequency table organizes data by counting occurrences of distinct categories or grouped numerical values. All these datasets can be effectively summarized with a frequency table:
- Student ages can be grouped into intervals (e.g., 18-20, 21-23) and counted.
- State of residence is a categorical variable where we count students per state.
- Majors are categorical, with counts for each distinct major.
- Gender is a categorical variable with counts for each gender category.

Snap & solve any problem in the app
Get step-by-step solutions on Sovi AI
Photo-based solutions with guided steps
Explore more problems and detailed explanations
A. Age of students in a business statistics course.
B. State of residence of students in a business statistics course.
C. Majors of students in a business statistics course.
D. Gender of students in a business statistics course.