QUESTION IMAGE
Question
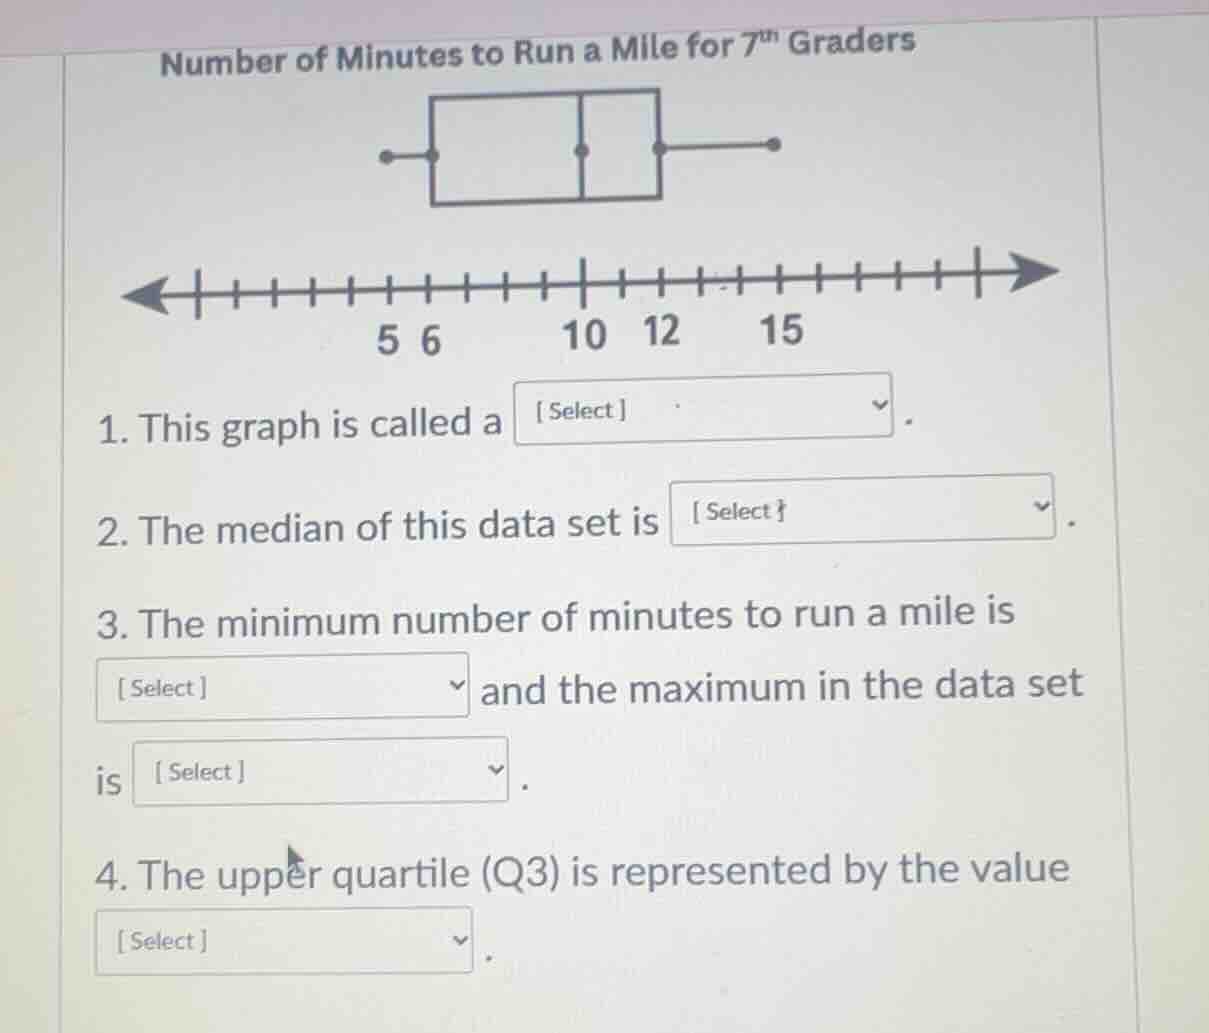
number of minutes to run a mile for 7th graders
- this graph is called a select .
- the median of this data set is select .
- the minimum number of minutes to run a mile is select and the maximum in the data set is select .
- the upper quartile (q3) is represented by the value select .
Step1: Identify the graph type
The plot shows a box with whiskers, which is a box-and-whisker plot (box plot), used to display data quartiles, min, max, and median.
Step2: Locate the median value
In a box plot, the vertical line inside the box is the median. This line aligns with 10 on the number line.
Step3: Find min and max values
The leftmost whisker endpoint is the minimum, aligning with 3. The rightmost whisker endpoint is the maximum, aligning with 17.
Step4: Locate upper quartile (Q3)
The right edge of the box represents the upper quartile, which aligns with 12 on the number line.

Snap & solve any problem in the app
Get step-by-step solutions on Sovi AI
Photo-based solutions with guided steps
Explore more problems and detailed explanations
- box-and-whisker plot (box plot)
- 10
- Minimum: 3; Maximum: 17
- 12