QUESTION IMAGE
Question
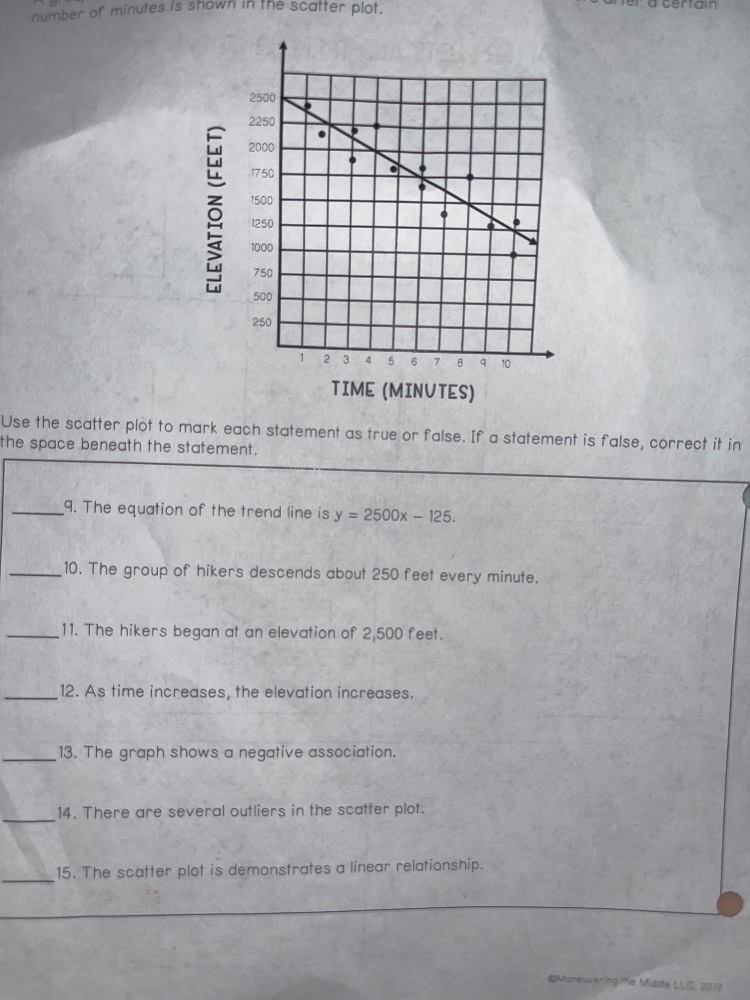
number of minutes is shown in the scatter plot.
use the scatter plot to mark each statement as true or false. if a statement is false, correct it in the space beneath the statement.
____9. the equation of the trend line is $y = 2500x - 125$.
____10. the group of hikers descends about 250 feet every minute.
____11. the hikers began at an elevation of 2,500 feet.
____12. as time increases, the elevation increases.
____13. the graph shows a negative association.
____14. there are several outliers in the scatter plot.
____15. the scatter plot is demonstrates a linear relationship.
Brief Explanations
- For statement 9: The trend line has a negative slope (decreasing) and y-intercept 2500. Using slope formula with (0,2500) and (10,1000), slope is $\frac{1000-2500}{10-0}=-125$, so equation is $y=-125x+2500$.
- For statement 10: The slope of -125 means descent of 125 feet per minute, not 250.
- For statement 11: The y-intercept (x=0) is 2500 feet, which is the starting elevation.
- For statement 12: The trend line decreases, so elevation falls as time increases.
- For statement 13: As time (x) increases, elevation (y) decreases, which is negative association.
- For statement 14: All points are close to the trend line, no clear outliers.
- For statement 15: Points cluster closely around a straight trend line, showing linear relationship.

Snap & solve any problem in the app
Get step-by-step solutions on Sovi AI
Photo-based solutions with guided steps
Explore more problems and detailed explanations
- False. Correct equation: $y = -125x + 2500$
- False. Correct: The group descends about 125 feet every minute.
- True
- False. Correct: As time increases, the elevation decreases.
- True
- False. Correct: There are no outliers in the scatter plot.
- True