QUESTION IMAGE
Question
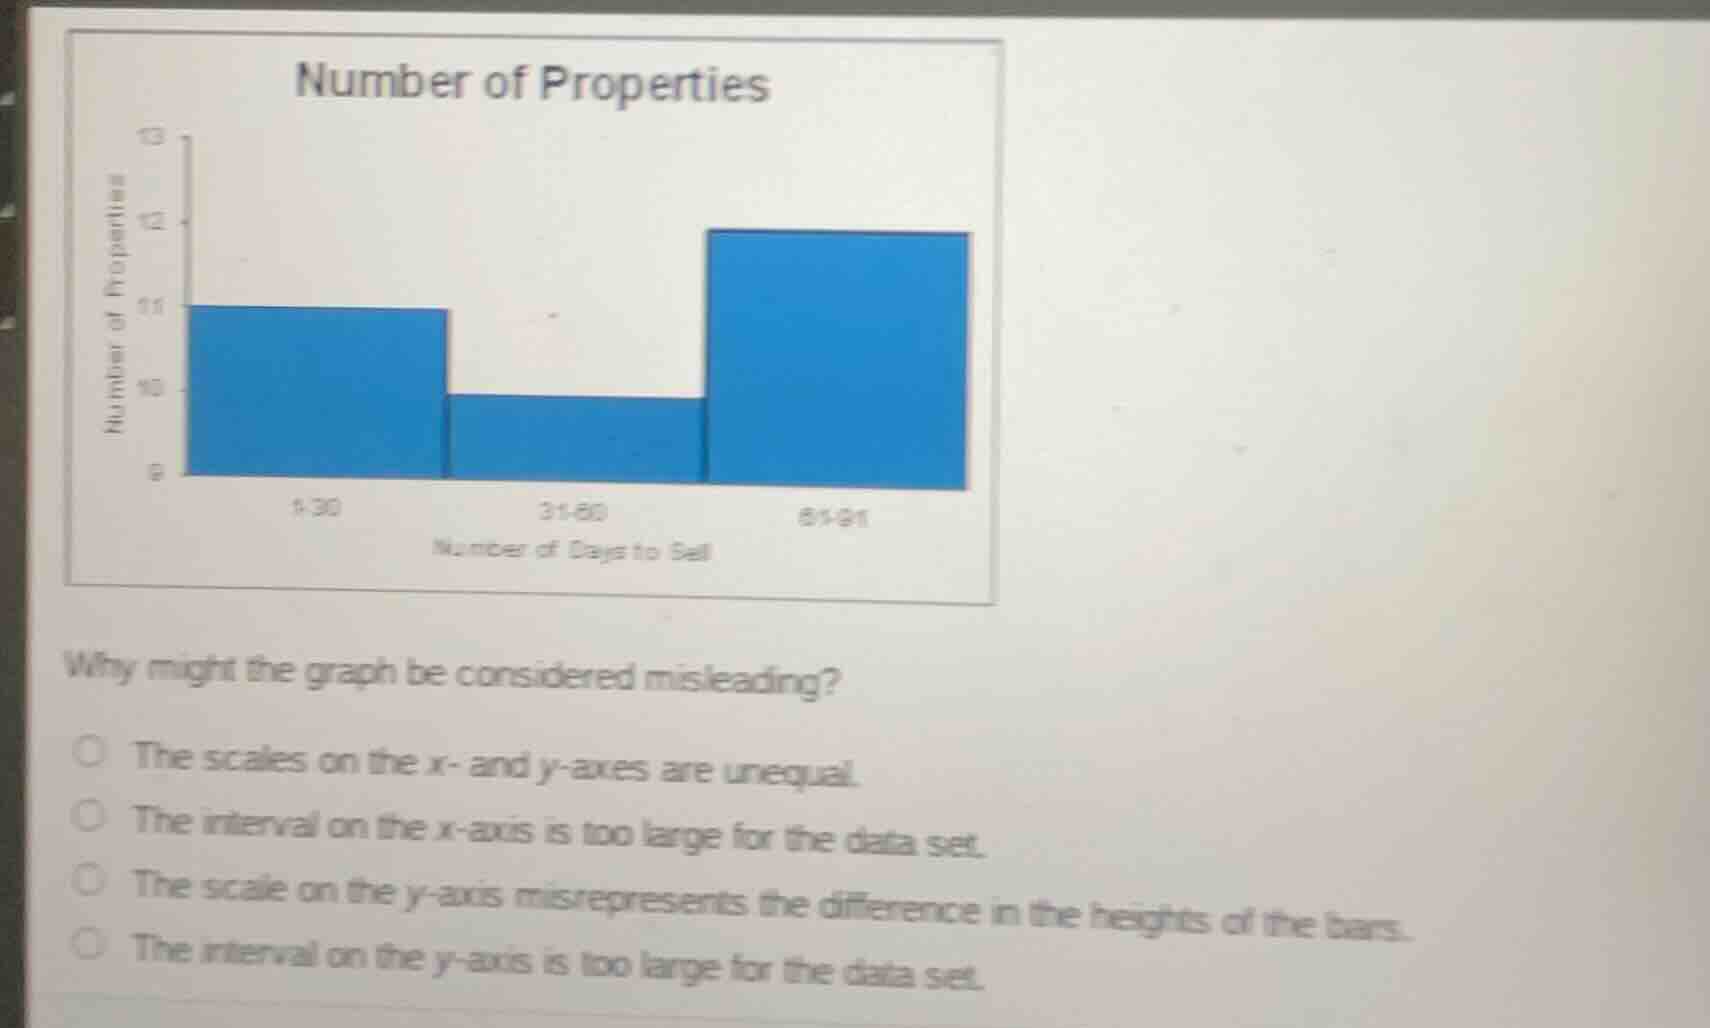
number of properties
why might the graph be considered misleading?
the scales on the x- and y-axes are unequal.
the interval on the x-axis is too large for the data set.
the scale on the y-axis misrepresents the difference in the heights of the bars.
the interval on the y-axis is too large for the data set.
The y-axis starts at 9 instead of 0, which visually exaggerates the difference between the bar heights. The actual differences (11-9=2, 12-9=3) are small, but the truncated axis makes the bars appear more different than they are.

Snap & solve any problem in the app
Get step-by-step solutions on Sovi AI
Photo-based solutions with guided steps
Explore more problems and detailed explanations
The scale on the y-axis misrepresents the difference in the heights of the bars.