QUESTION IMAGE
Question
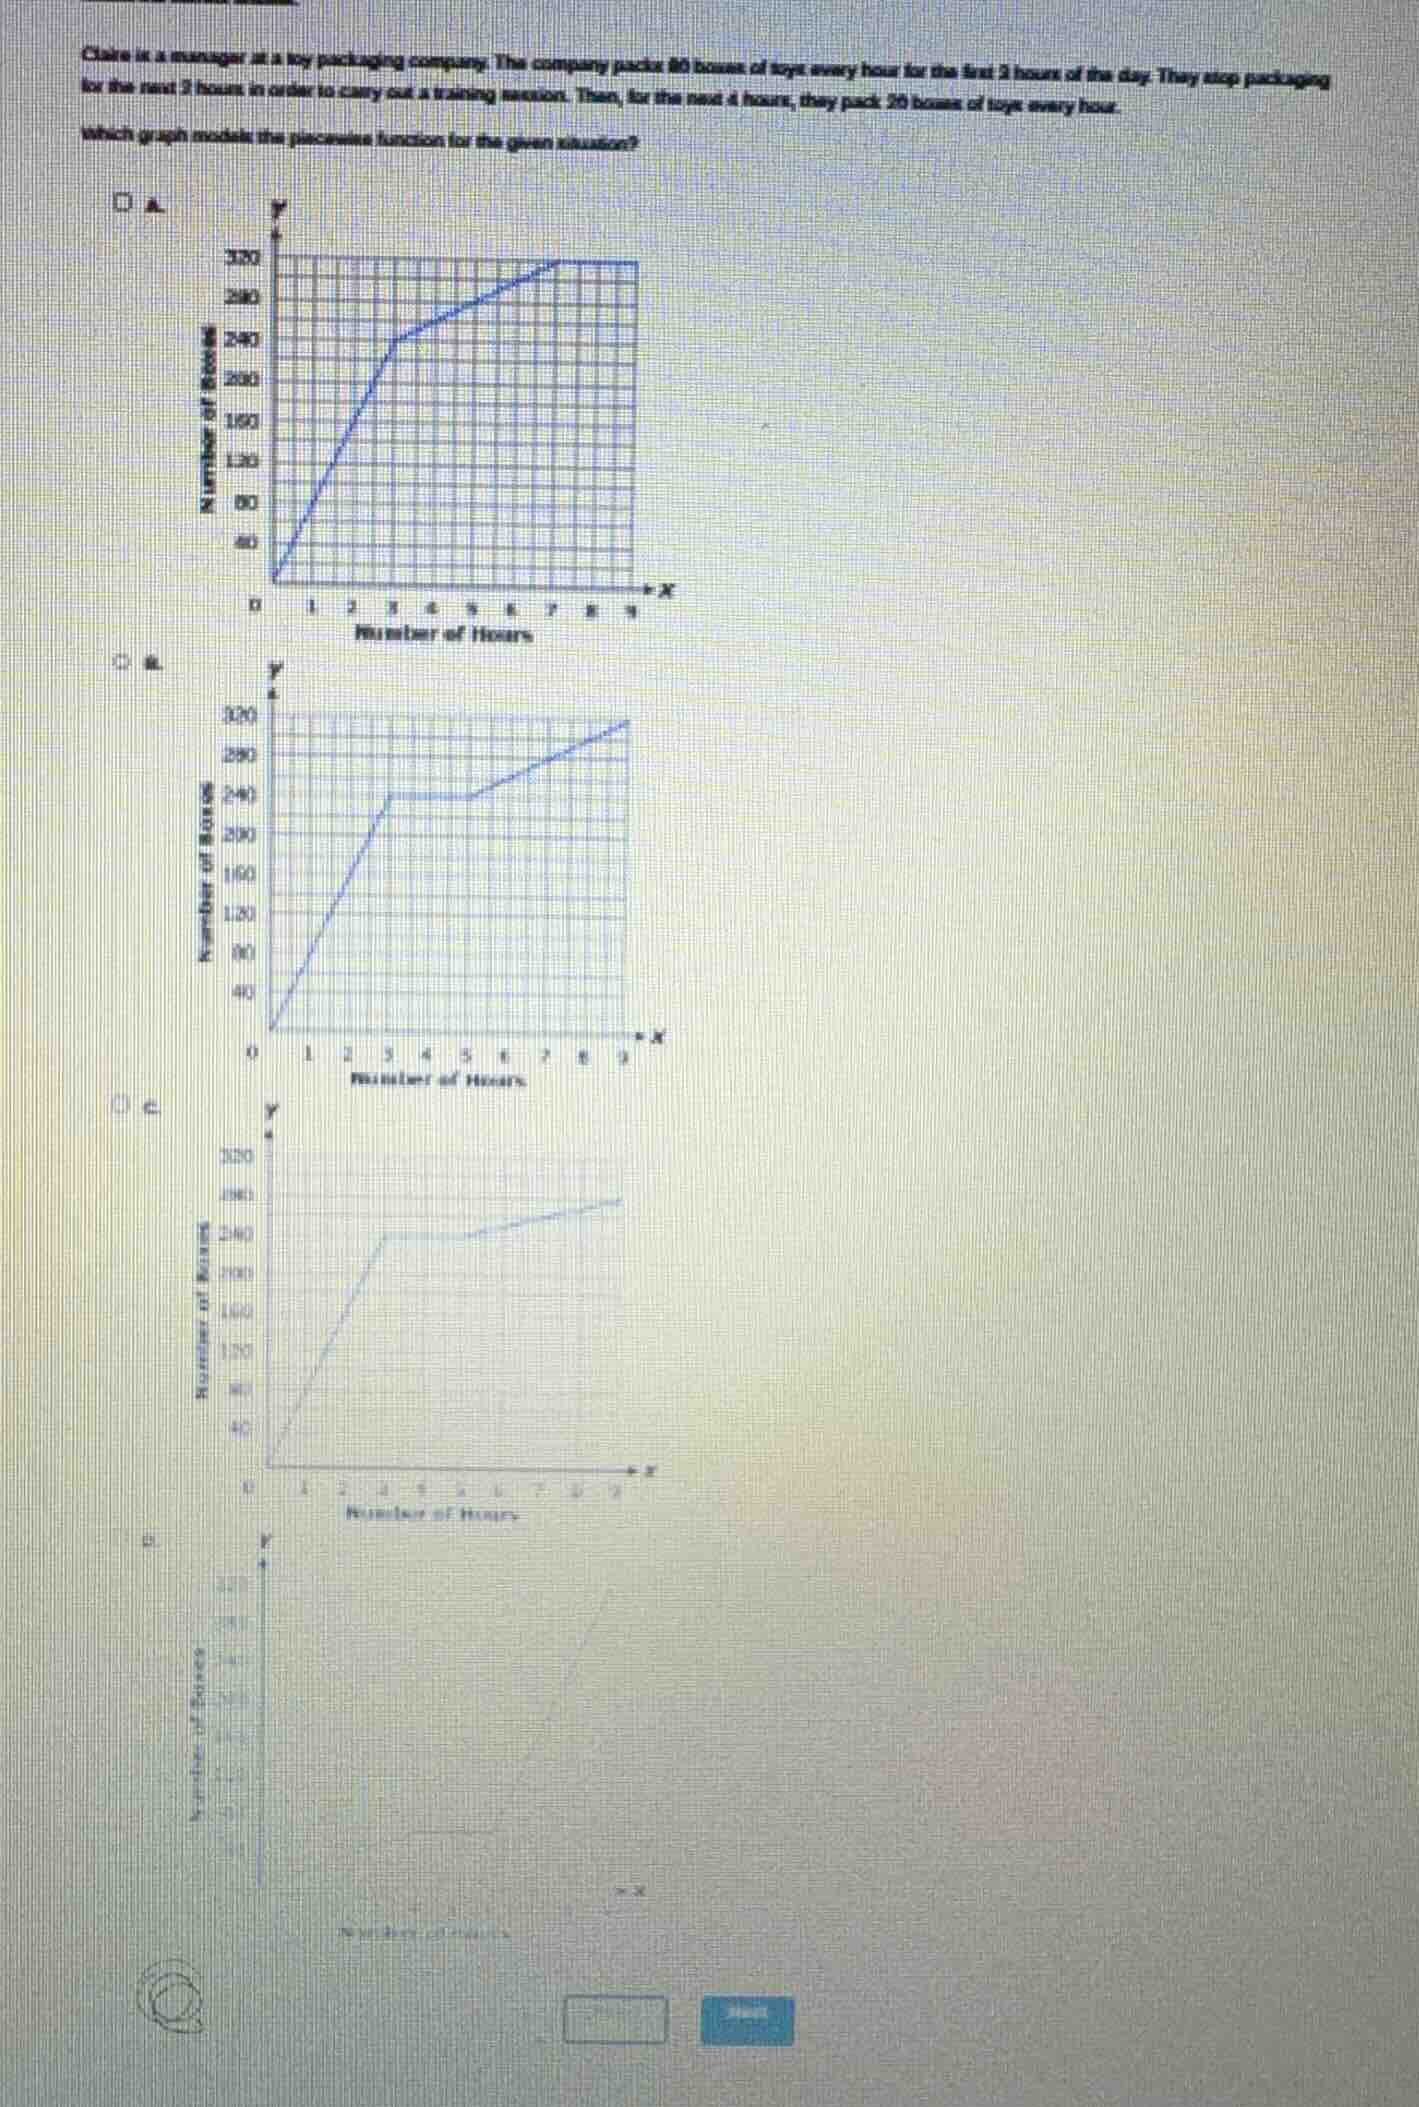
olive is a manager at a toy packaging company. the company packs 80 boxes of toys every hour for the first 3 hours of the day. they stop packaging for the next 2 hours in order to carry out a training session. then, for the next 4 hours, they pack 20 boxes of toys every hour. which graph models the piecewise function for the given situation?
Step1: Analyze the first phase (0 - 3 hours)
The company packs 80 boxes per hour for the first 3 hours. So the number of boxes after 3 hours is \( 80\times3 = 240 \) boxes. So from \( x = 0 \) to \( x = 3 \), the graph should be a line with slope 80, reaching \( y = 240 \) at \( x = 3 \).
Step2: Analyze the second phase (3 - 5 hours)
They stop packaging for 2 hours (from hour 3 to hour 5). So the number of boxes remains constant at 240 during this time. So the graph should be a horizontal line (slope 0) from \( x = 3 \) to \( x = 5 \).
Step3: Analyze the third phase (5 - 9 hours)
For the next 4 hours (from hour 5 to hour 9), they pack 20 boxes per hour. The number of boxes added in these 4 hours is \( 20\times4=80 \), so total boxes at hour 9 is \( 240 + 80=320 \). The slope here is 20, which is less steep than the first phase.
Now, let's check the graphs:
- Option A: No horizontal line (continues increasing), so incorrect.
- Option B: From 0 - 3, slope 80 (reaches 240), 3 - 5 horizontal (constant 240), 5 - 9 slope 20 (increases to 320). This matches.
- Option C: The initial slope or the horizontal part might not match (needs to check, but from our analysis, option B fits).
- Option D: Not visible properly, but from the first two steps, option B is correct.

Snap & solve any problem in the app
Get step-by-step solutions on Sovi AI
Photo-based solutions with guided steps
Explore more problems and detailed explanations
B (the graph with a steep line from 0 - 3 reaching 240, horizontal from 3 - 5, then a less steep line from 5 - 9)