QUESTION IMAGE
Question
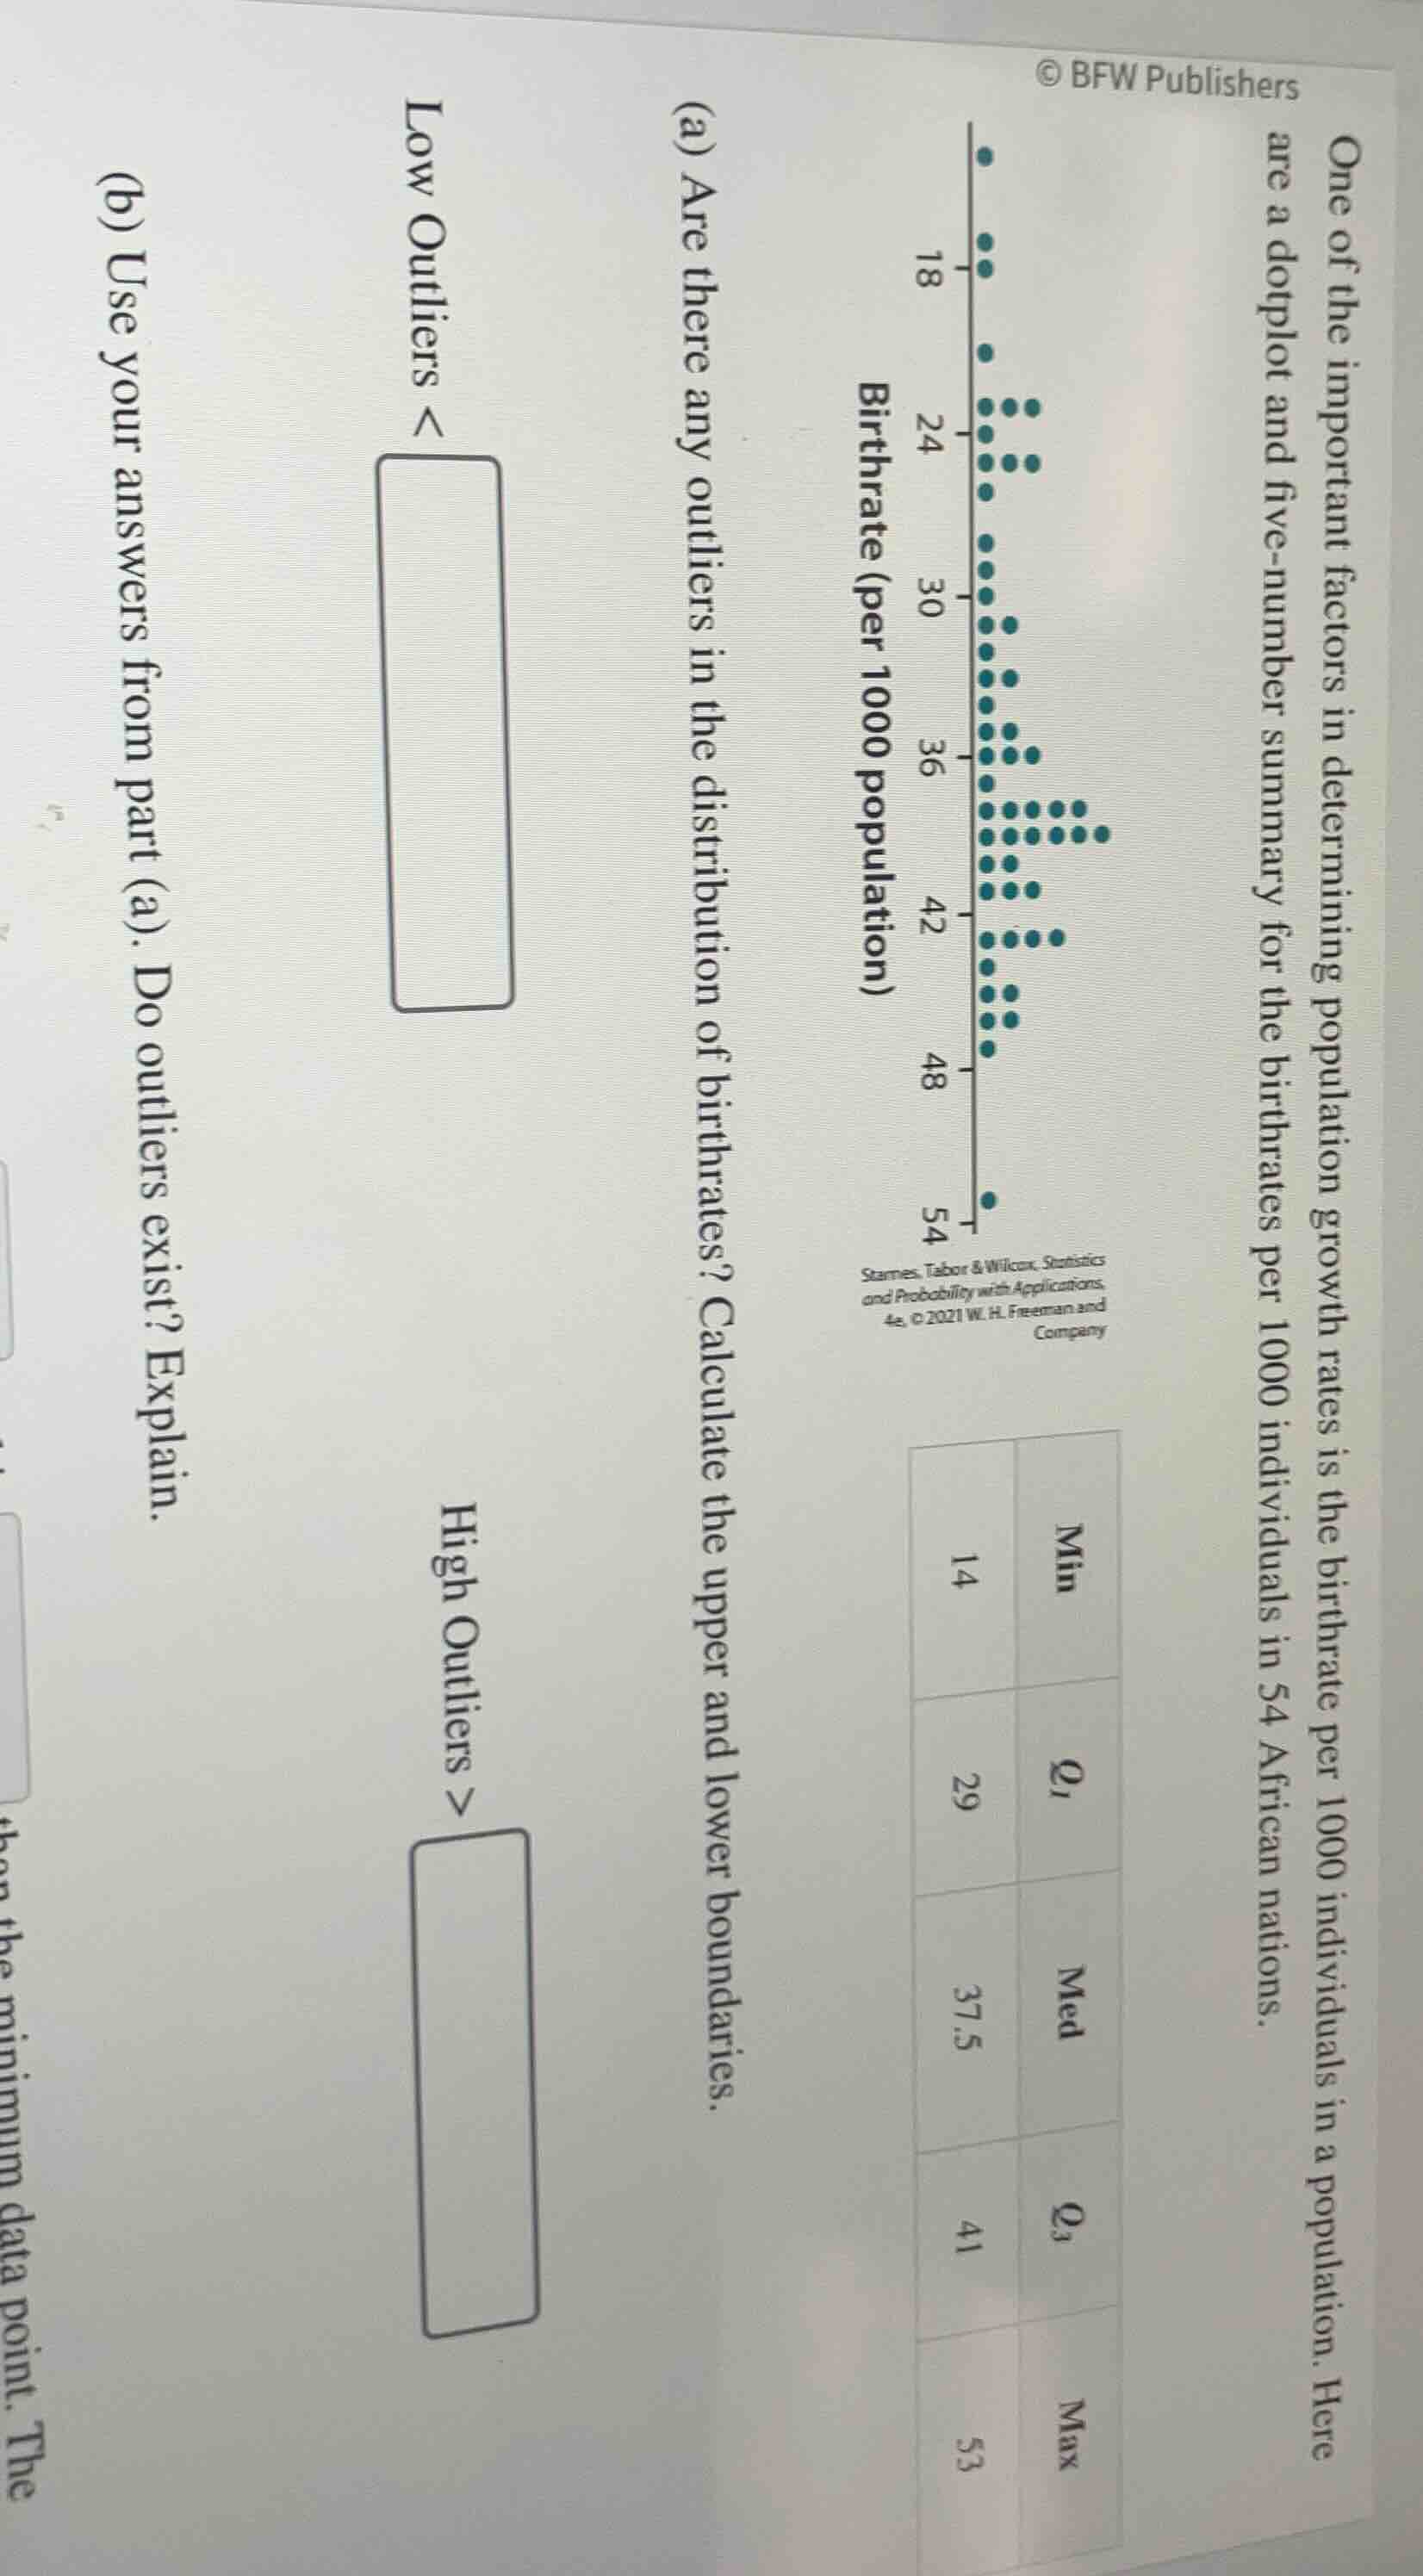
one of the important factors in determining population growth rates is the birthrate per 1000 individuals in a population. here are a dotplot and five - number summary for the birthrates per 1000 individuals in 54 african nations. (a) are there any outliers in the distribution of birthrates? calculate the upper and lower boundaries. low outliers <
high outliers >
(b) use your answers from part (a). do outliers exist? explain.
Part (a)
Step 1: Recall the IQR formula
The interquartile range (IQR) is calculated as \( IQR = Q_3 - Q_1 \). From the five - number summary, \( Q_1 = 29 \) and \( Q_3 = 41 \). So, \( IQR=41 - 29 = 12 \).
Step 2: Calculate the lower boundary for outliers
The lower boundary for outliers is given by the formula \( \text{Lower Boundary}=Q_1 - 1.5\times IQR \). Substitute \( Q_1 = 29 \) and \( IQR = 12 \) into the formula: \( \text{Lower Boundary}=29-1.5\times12=29 - 18 = 11 \).
Step 3: Calculate the upper boundary for outliers
The upper boundary for outliers is given by the formula \( \text{Upper Boundary}=Q_3+1.5\times IQR \). Substitute \( Q_3 = 41 \) and \( IQR = 12 \) into the formula: \( \text{Upper Boundary}=41 + 1.5\times12=41+18 = 59 \).
Step 4: Check for low outliers
The minimum value (Min) from the five - number summary is 14. Since \( 14>11 \) (the lower boundary), there are no low outliers.
Step 5: Check for high outliers
The maximum value (Max) from the five - number summary is 53. Since \( 53<59 \) (the upper boundary), there are no high outliers. But wait, looking at the dotplot, there is a data point at 54? Wait, the five - number summary says Max is 53. Maybe there is a typo, but based on the five - number summary:
Lower Outliers boundary: \( Q_1-1.5IQR = 29 - 1.5\times(41 - 29)=29 - 18 = 11 \)
High Outliers boundary: \( Q_3 + 1.5IQR=41+1.5\times(41 - 29)=41 + 18 = 59 \)
To determine if outliers exist, we compare each data point (from the dotplot and five - number summary) to the outlier boundaries. The lower boundary for outliers is \( 11 \) (calculated as \( Q_1-1.5IQR \)) and the upper boundary is \( 59 \) (calculated as \( Q_3 + 1.5IQR \)). The minimum value in the data is 14, which is greater than 11, so no low - end outliers. The maximum value in the five - number summary is 53 (and the dotplot has a point at 54, but 53 and 54 are both less than 59), so no high - end outliers. Thus, there are no outliers because all data points lie between the lower boundary (\( 11 \)) and upper boundary (\( 59 \)) of non - outlier values.

Snap & solve any problem in the app
Get step-by-step solutions on Sovi AI
Photo-based solutions with guided steps
Explore more problems and detailed explanations
Lower Outliers \( <11 \)
High Outliers \( >59 \)