QUESTION IMAGE
Question
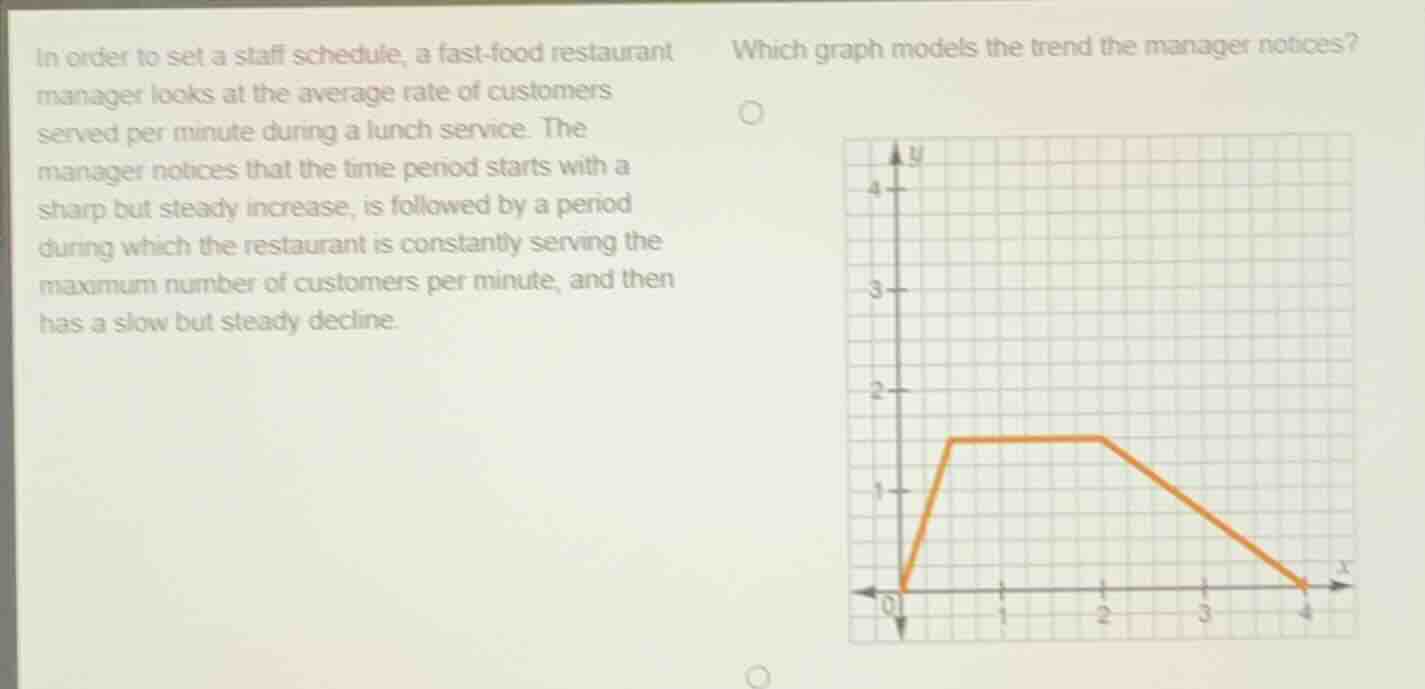
in order to set a staff schedule, a fast - food restaurant manager looks at the average rate of customers served per minute during a lunch service. the manager notices that the time period starts with a sharp but steady increase, is followed by a period during which the restaurant is constantly serving the maximum number of customers per minute, and then has a slow but steady decline. which graph models the trend the manager notices?
Step1: Analyze the trend description
The trend has three phases: sharp steady increase, constant maximum (horizontal line), slow steady decline.
Step2: Match with the given graph
The provided graph has:
- A steep (sharp) increase from (0,0) to some point (e.g., x=0.5, y=1.5)
- A horizontal line (constant) for a period (showing maximum rate)
- A slow (less steep) decline from the end of the horizontal line to (4,0)
This matches the described trend: sharp increase → constant → slow decline.

Snap & solve any problem in the app
Get step-by-step solutions on Sovi AI
Photo-based solutions with guided steps
Explore more problems and detailed explanations
The graph shown (with the orange line: steep increase, horizontal segment, slow decline) models the trend.