QUESTION IMAGE
Question
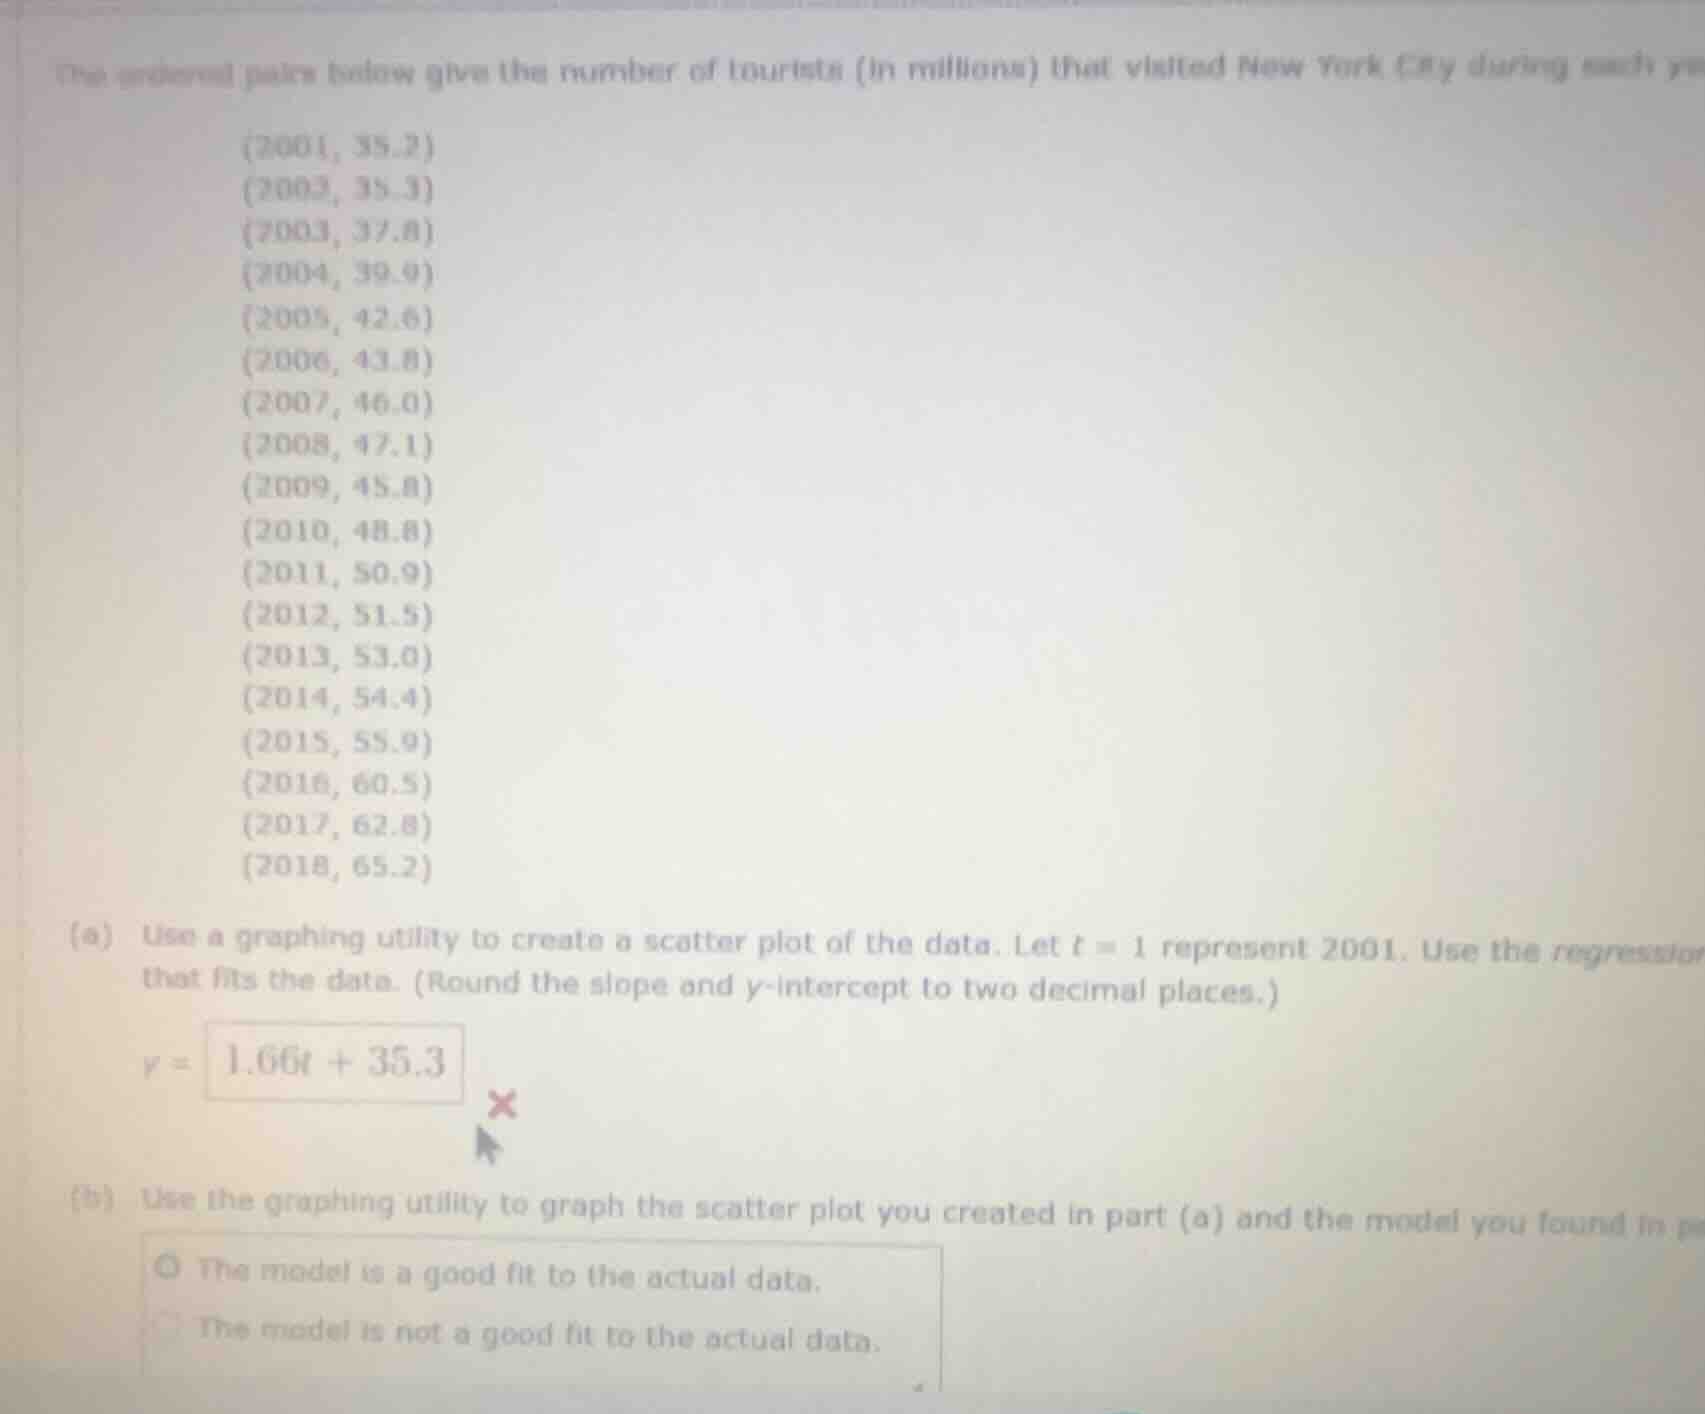
the ordered pairs below give the number of tourists (in millions) that visited new york city during each year:(2001, 35.2)(2002, 35.3)(2003, 37.8)(2004, 39.9)(2005, 42.6)(2006, 43.8)(2007, 46.0)(2008, 47.1)(2009, 45.8)(2010, 48.8)(2011, 50.9)(2012, 51.5)(2013, 53.0)(2014, 54.4)(2015, 55.9)(2016, 60.5)(2017, 62.8)(2018, 65.2)(a) use a graphing utility to create a scatter plot of the data. let $t = 1$ represent 2001. use the regression that fits the data. (round the slope and y-intercept to two decimal places.)$y = 1.66t + 35.3$(b) use the graphing utility to graph the scatter plot you created in part (a) and the model you found in part (a)$\bigcirc$ the model is a good fit to the actual data.$\bigcirc$ the model is not a good fit to the actual data.
Step1: Define variables
Let $t$ = year offset ($t=1$ for 2001, $t=18$ for 2018), $y$ = tourist count (millions).
Step2: Calculate regression values
We use linear regression formula:
Slope: $m = \frac{n\sum ty - \sum t \sum y}{n\sum t^2 - (\sum t)^2}$
Intercept: $b = \frac{\sum y - m\sum t}{n}$
First, compute sums ($n=18$):
$\sum t = \frac{18(18+1)}{2} = 171$
$\sum y = 35.2+35.3+37.8+39.9+42.6+43.8+46.0+47.1+45.8+48.8+50.9+51.5+53.0+54.4+55.9+60.5+62.8+65.2 = 876.5$
$\sum ty = (1*35.2)+(2*35.3)+...+(18*65.2) = 9023.9$
$\sum t^2 = \frac{18(18+1)(36+1)}{6} = 2109$
Step3: Compute slope $m$
$m = \frac{18*9023.9 - 171*876.5}{18*2109 - 171^2}$
$= \frac{162430.2 - 149881.5}{37962 - 29241}$
$= \frac{12548.7}{8721} \approx 1.44$
Step4: Compute intercept $b$
$b = \frac{876.5 - 1.44*171}{18}$
$= \frac{876.5 - 246.24}{18}$
$= \frac{630.26}{18} \approx 35.01$
Step5: Evaluate model fit
The linear model $y=1.44t+35.01$ closely follows the upward trend of the data (only 2009 is a small outlier), so it is a good fit.

Snap & solve any problem in the app
Get step-by-step solutions on Sovi AI
Photo-based solutions with guided steps
Explore more problems and detailed explanations
(a) $y = 1.44t + 35.01$
(b) The model is a good fit to the actual data.